C#7: Tools

I have spent the first couple of months of 2017 learning about the new features in C#7. This would not have been possible without some tools to help me play around with the new language syntax and associated types. Since we have to wait a little longer until Visual Studio 2017 is released, I thought you might like to know what tools I have been using to tinker in all things C#7.

LINQPad Beta

Link: http://www.linqpad.net/Download.aspx#beta

While early releases of Visual Studio 2017 (scheduled for release on March 7th) support the language, I initially found the release candidate to be unstable and frustrating. Not only that, but it can be cumbersome to spin up a quick example using Visual Studio, so I turned to my trusty friend, LINQPad.

LINQPad Beta showing me my return is missing a ref

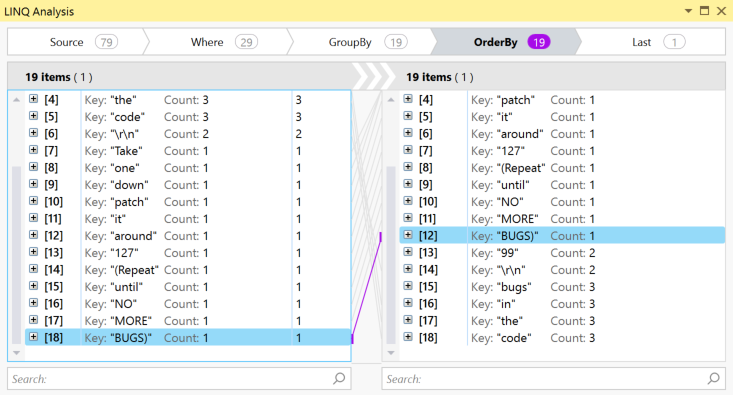
I cannot recommend LINQPad enough, it is a fantastic tool for prototyping, poking around data sources, and more besides, like tinkering with language features you don't yet understand. While LINQPad's current release only supports the C# language up to version 61, the beta release also supports C# version 7. Not only can you use the language, but with the fantastic analysis window, you can see how Roslyn breaks down each part of the code. If you want to get started quickly, easily play around with the cool new features, and have a powerful tool for digging deeper as the need arises, the LINQPad beta is the tool to get.

Visual Studio 2017 RC

Link: https://www.visualstudio.com/downloads/
Visual Studio 2017 RC splash

Yes, I know I said it was unstable and frustrating, but that was before, way back in January. These days the RC is much, much better and with the release date set for March 7th, there was never a better time to install Visual Studio 2017 RC and get a head start on getting to know some of the new things it can do, including C# 7. Tuples are fun, but poking around with them in the debugger is funner.

OzCode

Link: https://oz-code.com/
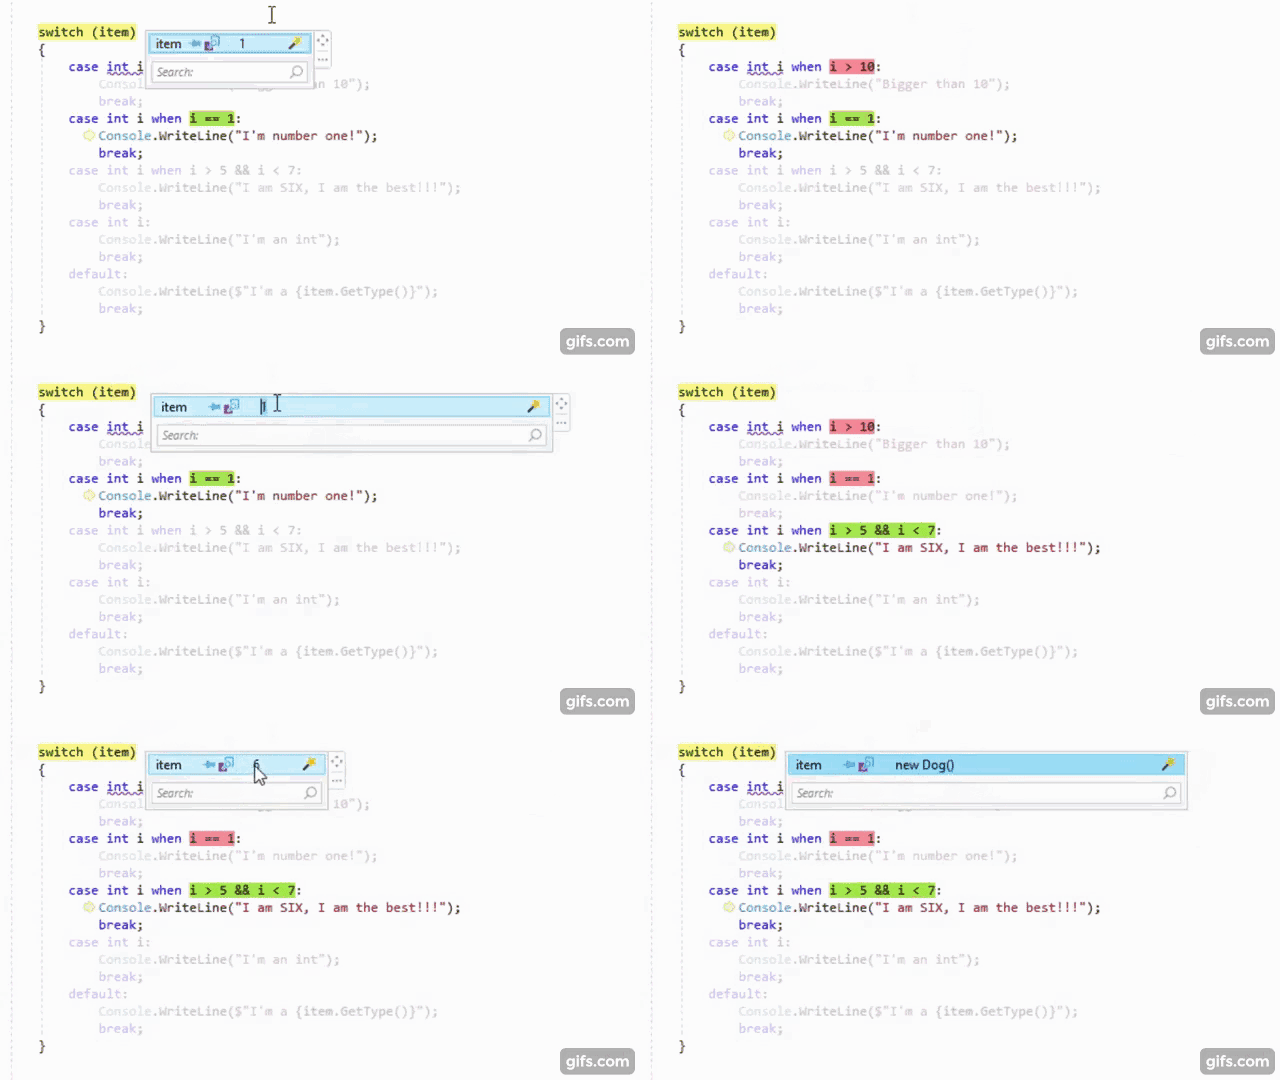
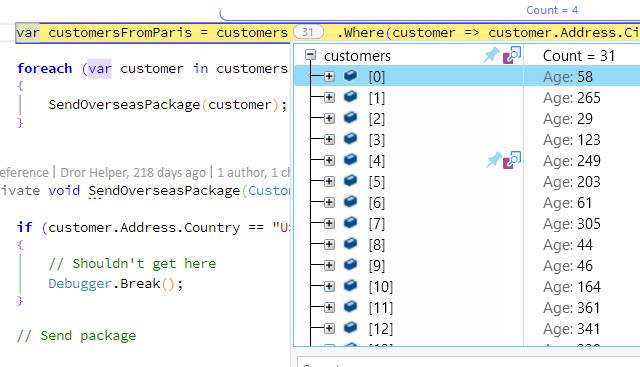
Pattern matching in OzCode

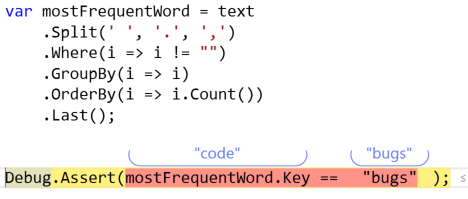
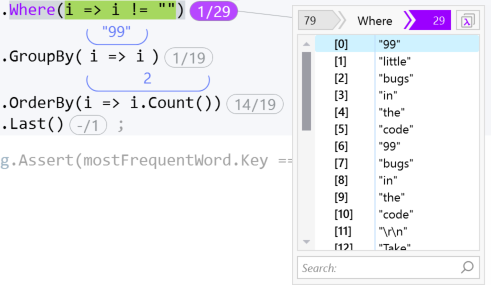
It is no secret that I love OzCode, the magical debugging extension for Visual Studio. It is so well-known that they asked me to be part of their OzCode Magician community program. So, it should come as no surprise that I have been using OzCode in my exploration of C#7. As the Visual Studio 2017 RC has matured, the clever people over at CodeValue have been creating previews of OzCode version 3, including amazing LINQ debugging support. Recently, I got to try an internal build that included support for all the cool new things in C#7.

OzCode 3 will be released on March 7th, the same day as Visual Studio 2017.

Documentation

Link: https://docs.microsoft.com/dotnet/articles/csharp/csharp-7

Never underestimate the power of reading documentation, it is one of the best tools out there. For my C#7 posts, I relied heavily on the new docs.microsoft.com site, specifically the .NET articles on C#. Not only is this a fantastic resource, but it has built-in support for commenting on the documentation so that you can ask questions and contribute to their improvement.

In Conclusion

This is the entire list of tools I used for my C#7 investigations. Try them out and get an early start on C#7 fun before the March 7th release of all the C#7 goodness. Happy tinkering and if you stumble on any useful tools, please share in the comments!

  1. It also supports SQL, F#, and VB []

OzCode: Reveal With Reveal

In my last post, I revealed that I am a magician; an OzCode magician1. I also revealed the new LINQ support currently in EAP. Since that was two reveals in one, I thought that I would look at another OzCode feature today coincidentally called Reveal.

I remember this specific feature as "favourites for properties" although I am reliably informed by the OzCode team, their website, and their documentation that it is in fact called "Reveal"2. Reveal was the feature that first lured me into regular use of OzCode and if it is the only feature you use, you will still wonder how you really survived without it.

When debugging, we can spend lots of time drilling down into objects to find the value of various properties and sub-properties. This can get especially tiresome when we're looking at a few similar objects since we repeat the same steps. Although pinning certain values is helpful, it does not really solve the initial issue of drilling down to find the thing to pin.

With Reveal, we can make life much simpler by elevating the details of an object to its summary; like an on-the-fly custom ToString implementation. Not only does this help with looking at one item, but it really helps with collections of similar items. For example3:

Animated GIF showing how to use Reveal in OzCode

Any properties that are "revealed" carry across to the rest of the debug session and beyond; once you have revealed some properties, they stay revealed until you decide you do not want them to be anymore, even across debug sessions.

Animated GIF showing how the revealed properties remain revealed

You can even see (and change) your revealed properties directly within the LINQ analysis window.

Animated GIF of using Reveal inside the new LINQ analysis feature of OzCode

Finally, revealed properties propagate up the object hierarchy allowing you to surface values from deeper in your object tree. This can really be a huge time saver, especially since the revealed properties are remembered across sessions. No more hovering over multiple things to find what you're looking for and no more writing custom ToString overrides, debug visualizers, or other workarounds.

Hopefully, this overview of Reveal in OzCode has demonstrated not only why I love it so much, but also how valuable it can be. I genuinely believe OzCode to be an essential tool in any .NET developer's kit, but since you may mistake me for some corporate shill, you should not take my word for it; try OzCode out for yourself with a free trial (or take part in the EAP). Stop performing workarounds and start performing magic.

  1. Read as Sean Connery as James Bond []
  2. and apparently it doesn't matter how often I tell them they are wrong []
  3. To demonstrate, I am using the handy demo app from OzCode, which you can find on GitHub []

I Am an OzCode Magician and I Have a New LINQ Trick

It has probably not gone unnoticed by those whoocm_logo know me that I really like the OzCode extension to Visual Studio. Now, I have an awesome glass brick with my name etched in it as proof1. I am happy to announce that I was recently invited to be a part of the OzCode Magician Program; an award in recognition of my genuine enthusiasm and support for OzCode over the last couple of years.

linqBug

What I really like about this is that I get to occasionally preview a new feature or two. Of course, sometimes I will be sworn to secrecy on what those features are, but thankfully, the current feature I have been allowed to play with is no secret at all. It was showcased in OzCode's recent webinar and recently made publicly available as an EAP2, so you can try it too. To whet your appetite, here is a sneak preview of the new magical LINQ debugging support.

numericIndicators

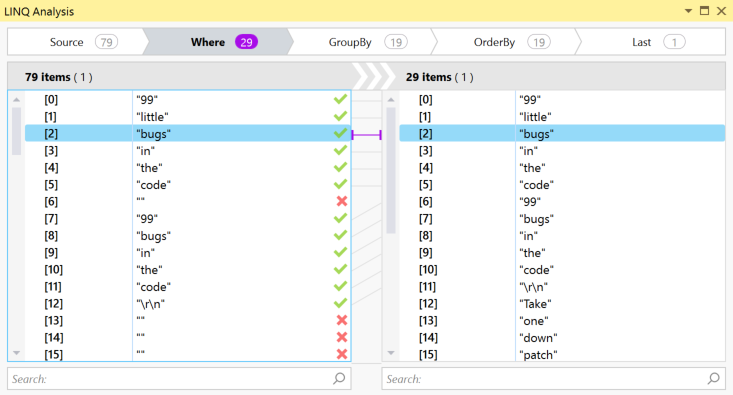
In this latest update to OzCode, we get some really nice visualizations of our LINQ queries, enabling us to see the queries step-by-step. No more refactoring code just to see what that Where will do.

quickDatatip

The new LINQ debugging allows a user to step into a specific part of the query chain on a specific iteration and see exactly what the outcome is, and it can show you how inputs map to outputs on many of the most common LINQ operations.

detailsQueryToolWindow

At the time of writing, the EAP only supports fluent syntax LINQ but I am assured that query syntax support is on its way. So, go register for the EAP now and give it a try for yourself. It's magical!

  1. also weighty enough to be a prop in an episode of CSI []
  2. Early Access Preview []

Merging multiple accounts on UserEcho

UserEcho is a service employed by the likes of OzCode and SublimeText for collecting and managing customer issues and suggestions; often regarding software features and bugs. It enables users and developers to discuss bugs and ideas, and respond to frequently asked questions.

OzCode UserEcho landing page

Recently, I signed into the OzCode UserEcho site using my Google credentials. UserEcho supports the OpenID identity system, providing a wide range of ways to authenticate. Upon logging in, I was immediately confused; where was the issue I had raised a week or two earlier? I was certain it should be there but it was not. After a little thought, I realised I may have logged in with the wrong credentials, inadvertently creating a new account. I logged out and then, using my GitHub account to authenticate instead of Google, tried logging back in. Voila! My issue appeared.

For some, this would probably be the end of it, but it bugged me that I now had two accounts. You may think this is no big deal and you are right, but it was bothering me1.

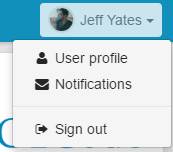
Settings dropdown on UserEcho

Using the dropdown captioned with my name at the top-right of the UserEcho site, I chose User Profile. At the bottom of the subsequent page, I found a table of OpenID logins that the account used but no way to edit it. How could I merge my accounts or add new OpenID identities?

OpenID table on UserEcho user profile screen

After searching around the UserEcho site a bit and trying a few Google searches2, I was almost ready to contact UserEcho for some help (or just give up), but then I had an idea. If UserEcho was like most sites these days, it probably keyed accounts using a primary email address for the user. So, I checked the two UserEcho accounts I knew I had and confirmed they had different email addresses.

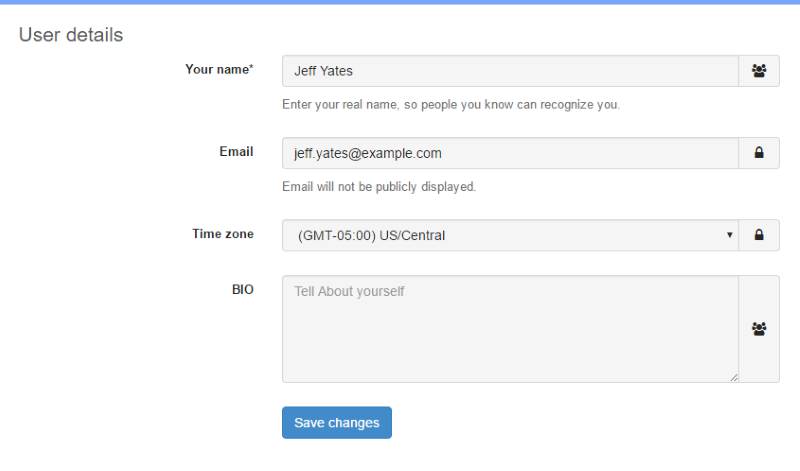
User details section of a UserEcho profile

I edited the email address for one of the two accounts to match the other, triggering UserEcho to send a verification email3, so I followed the instructions and verified the email address change.

UserEcho table of accounts with the same email

Then I returned to the User Profile screen in OzCode's UserEcho. At the bottom, below the OpenID table, I was now presented with a message saying that there were other accounts with the same email address, including a Merge button. I clicked that button and immediately, the table showed both the Google and GitHub logins.

OpenID table in UserEcho showing GitHub and Google IDs

So, there you go. If you have multiple accounts for a UserEcho product site, make sure the email addresses match and that you have verified the email address on each account, then view one and click Merge. Job done.

  1. In writing this blog and generating the screenshots, I discovered I actually had three accounts! []
  2. and maybe one Bing []
  3. just making sure you're still you []

Tracepoints, Conditional Breakpoints, and Function Breakpoints

We've all been there: we step through our code with breakpoints and it works just fine, but run it without ever hitting a breakpoint and our code explodes in a fiery ball of enigmatic failure. Perhaps the failure only happens after the 1000th call of a method, when a variable is set to a specific value, or the value of a variable changes. These bugs can be hard to investigate without actually modifying the software that has the bug, which then means you are no longer debugging the same software that had the bug and might mean the bug disappears1.

Thankfully, Visual Studio has our backs on tracking down some of these more obscure bugs. Visual Studio allows us to modify our breakpoints to only break on certain conditions (like the 5th loop iteration, or when a file is open), to output text to the debug window, or to just output text and not actually break into our code. We can even create breakpoints that break on any function that matches a name we provide, just in case you don't even know which code it's actually calling.

Though I discuss the 2015 experience, the features themselves have been around for quite some time. I would not be surprised if this were the first time you had heard about these breakpoint settings, they have always been somewhat hidden away from the primary workflow. Even now, with the updated user experience, they are not obvious unless you go exploring.  If you want to see how to use them in your variant of Visual Studio, or get more information on breakpoints in 2015, MSDN has you covered (2003|2005|2008|2010|2012|2013|2015).

Conditions and Actions

Floating breakpoint toolbar

Let's begin by taking a look at adding conditions and tracepoints. When you add a breakpoint to a line of code, either by using the F9 keyboard shortcut or left-clicking in the code margin, a little toolbar appears to the upper right of the cursor2 . The toolbar has two icons: the first is called Settings…, where all the cool stuff lives; the second is called Disable Breakpoint, which is very useful if you have customized the breakpoint3. If you click the Settings… button, you will see an inline dialog with two checkboxes; Conditions and Actions4.

If you check the first box, Conditions, you will be presented with various fields for specifying a condition under which the breakpoint fires. There are three types of condition;

  1. Conditional Expression
  2. Hit Count
  3. Filter
Adding a condition to a breakpoint

Conditional Expression conditions allow you to specify a condition based on variables within your code. You can break on when a specific condition is met, or when a condition changes (this allows you to break when a variable changes value, for example).

Hit Count conditions allow you to break once after the breakpoint has been hit a specific number of times (such as on the fifth index of an array in a loop), every time after the breakpoint has been hit a specific number of times, or every time the hit count is a multiple of a specific number (like every other hit, or once every five hits).

Filter conditions allow you to specify filters based on process, thread, and machine names, and process and thread identifiers.

Conditional breakpointYou can add multiple conditions to a breakpoint, which all have to match for the breakpoint to fire. When a condition is applied to a breakpoint, the red circle will have a white plus symbol inside it.

Adding output text to a breakpoint

If you check the Actions box, you can specify text to be outputted when the breakpoint fires. By default, a checkbox named Continue Execution will be checked because, usually, if specifying output text, you want a tracepoint rather than a breakpoint. However, if you want to break and output text, you can uncheck this additional checkbox.

Non-breaking breakpoint (aka tracepoint)When a breakpoint is set to continue execution, the red circle changes into a red diamond. If a condition is also applied, the diamond has a white cross Conditional non-breaking breakpoint (aka tracepoint)in it.

If you use the Oz-code extension for Visual Studio, tracepoints are given some additional support with a quick action to add a tracepoint and a tracepoint viewer that shows you just tracepoints.

Function Breakpoints

Adding a function breakpoint

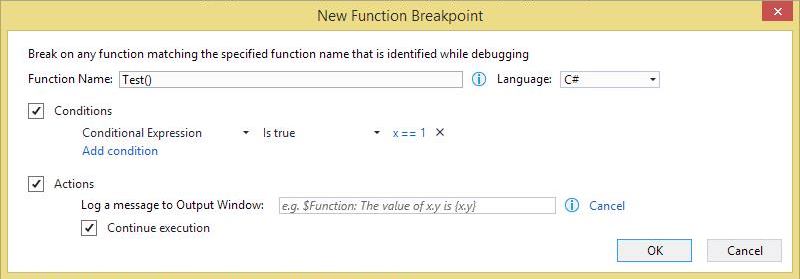
So far, we've looked at traditional breakpoints that are set on specific lines of code. Function breakpoints are set against function names. To add a function point, use the Visual Studio menu to go to Debug→New Breakpoint→Function Breakpoint…5. Selecting this will show a dialog where you can specify the function name (qualifying it as you require), and the language to which the breakpoint applies. You can also specify conditions and actions as with any other breakpoint.

In Conclusion…

Visual Studio is a complex development environment, which unfortunately leads to some of its cooler features being harder to find. I hope you find this introduction to breakpoint superpowers useful, if you do or if you have more Visual Studio debugging tips, I'd love to hear from you in the comments.

Today's featured image is "Debugging the Computer" by Jitze Couperus. The image is licensed under CC BY 2.0. Other than being resized, the image has not been modified.

  1. yay, fixed it… []
  2. This also appears if you hover over an existing breakpoint in the margin []
  3. Deleting the breakpoint would also delete any customization, but disabling does not []
  4. This dialog can also be reached by right-clicking the breakpoint and choosing either Conditions… or Actions… or by hitting Alt+F9, C; the only difference here is that one of the two checkboxes will get checked automatically []
  5. You can also add one via the keyboard with Alt+F9, B or the New… dropdown in the Breakpoints tool window []