C#6: Auto-property Initializers and Expression-Bodied Properties

Last week, I discussed the new null-conditional operators added in C#6. This week, I would like to discuss two features that are awesome but could lead to some confusion: auto-property initializers and expression-bodied properties1.

Auto-initialized Properties

Before C#6, if we wanted to properly define an immutable property that had some expensive initialization, we had to do the following2:

public class MyClass
{
    public MyClass()
    {
        _immutableBackingField = System.Environment.CurrentDirectory;
    }

    public string ImmutableProperty
    {
        get
        {
            return _immutableBackingField;
        }
    }

    private readonly string _immutableBackingField;
}

Some people often use the shortcut of an auto-implemented property using the following syntax:

public class MyClass
{
    public MyClass()
    {
        ImmutableProperty = System.Environment.CurrentDirectory;
    }

    public string ImmutableProperty
    {
        get;
    }
}

However, defining properties like this means they are still mutable within the class (and its derivations). Using a backing field with the `readonly` keyword not only ensures that the property cannot be changed anywhere outside of the class construction, it also expresses exactly what you intended. Being as clear as possible is helpful for anyone who has to maintain the code in the future, including your future self.

From what I have read and heard, the main driver for using auto-implemented properties was writing less code. It somewhat saddens me when clarity of intent is replaced by speed of coding as we often pay for it later. Thankfully, both can now be achieved using initializers. Using this new feature, we can condense all that code down to just this:

class MyClass
{
    public int ImmutableProperty { get; } = System.Environment.CurrentDirectory;
}

It is a thing of beauty3. Behind the scenes, the compiler produces equivalent code to the first example with the `readonly` backing field.

Of course, this doesn't help much if you need to base your initialization on a value that is passed in via the constructor. Though a proposed feature for C#6, primary constructors, would have helped with this, it was pulled from the final release. Therefore, if you want to use construction parameters, you will still need a backing field of some kind. However, there is another feature that can help with this. That feature is expression-bodied properties4.

Expression-bodied Properties

An expression-bodied property looks like this:

class MyClass
{
    public int ImmutableProperty => 42;
}

This is equivalent to:

public class MyClass
{
    public int ImmutableProperty
    {
        get
        {
            return 42;
        }
    }
}

Using this lambda-esque syntax, we can provide more succinct implementations of our read-only properties. Consider this code:

public class MyClass
{
    public MyClass(string value)
    {
        _immutableBackingField = value;
    }

    public string ImmutableProperty
    {
        get
        {
            return _immutableBackingField;
        }
    }

    private readonly string _immutableBackingField;
}

Using expression-body syntax, we can write it as:

public class MyClass
{
    public MyClass(string value)
    {
        _immutableBackingField = value;
    }

    public string ImmutableProperty => _immutableBackingField;

    private readonly string _immutableBackingField;
}

But for the additional backing field declaration, this is almost as succinct as using an auto-implemented property. Hopefully, this new syntax will encourage people to make their intent clear rather than using the auto-implemented property shortcut when implementing immutable types.

Caveat Emptor

These new syntactical enhancements make property declaration not only easier to write, but in many common cases, easier to read. However, the similarities in these approaches can lead to some confusing, hard-to-spot bugs. Take this code as an example:

using System;

public class MyClass
{
    public string CurrentDirectory1 { get; } = Environment.CurrentDirectory;
    public string CurrentDirectory2 => Environment.CurrentDirectory;
}

Here we have two properties: `CurrentDirectory1` and `CurrentDirectory2`. Both seem to return the same thing, the current directory. However, a closer look reveals a subtle difference.

Imagine if the current directory is `C:\Stuff` at class instantiation but gets changed to `C:\Windows` some time afterward; `CurrentDirectory1` will return `C:\Stuff`, but `CurrentDirectory2` will return `C:\Windows`. The reason for this difference is the syntax used. The first property uses auto-initialization; it captures the value of `Environment.CurrentDirectory` on construction and always returns that captured value, even if `Environment.CurrentDirectory` changes. The second property uses an expression-body; it will always return the current value of `Environment.CurrentDirectory`, not the value of `Environment.CurrentDirectory` on construction of the `MyClass` instance.

I am sure you can imagine more serious scenarios where such a mix-up could be a problem. Do you think this difference in behavior will be obvious enough during code review or when a bug is reported? I certainly don't and I'm writing this as a way of reinforcing it in my own mind. Perhaps you have already dealt with a bug relating to this; if so, share your tale of woe in the comments.

In Conclusion..

I am by no means intending to discourage the use of these two additions to the C# language; they are brilliant and you should definitely add them to your coding arsenal, but like many things in software development, there is a dark side. Understanding the pros and cons of any such feature is important as it enables us to spot errors, fix bugs, and write good tests. This new confusion in the C# world is just another encouragement to code clearly, test sensibly, and be aware of the power in the tools and languages we use.

  1. No one else seems to by hyphenating "expression-bodied" but it doesn't make sense to me otherwise; what is a "bodied property"? []
  2. Yes, I know that `System.Enviroment.CurrentDirectory` isn't really expensive; this is for illustrative purposes []
  3. especially if you are keen on making sure your code expresses exactly what you mean []
  4. expression-bodied methods are also possible, but I'm not touching on that in this post []

Tracepoints, Conditional Breakpoints, and Function Breakpoints

We've all been there: we step through our code with breakpoints and it works just fine, but run it without ever hitting a breakpoint and our code explodes in a fiery ball of enigmatic failure. Perhaps the failure only happens after the 1000th call of a method, when a variable is set to a specific value, or the value of a variable changes. These bugs can be hard to investigate without actually modifying the software that has the bug, which then means you are no longer debugging the same software that had the bug and might mean the bug disappears1.

Thankfully, Visual Studio has our backs on tracking down some of these more obscure bugs. Visual Studio allows us to modify our breakpoints to only break on certain conditions (like the 5th loop iteration, or when a file is open), to output text to the debug window, or to just output text and not actually break into our code. We can even create breakpoints that break on any function that matches a name we provide, just in case you don't even know which code it's actually calling.

Though I discuss the 2015 experience, the features themselves have been around for quite some time. I would not be surprised if this were the first time you had heard about these breakpoint settings, they have always been somewhat hidden away from the primary workflow. Even now, with the updated user experience, they are not obvious unless you go exploring.  If you want to see how to use them in your variant of Visual Studio, or get more information on breakpoints in 2015, MSDN has you covered (2003|2005|2008|2010|2012|2013|2015).

Conditions and Actions

Floating breakpoint toolbar

Let's begin by taking a look at adding conditions and tracepoints. When you add a breakpoint to a line of code, either by using the F9 keyboard shortcut or left-clicking in the code margin, a little toolbar appears to the upper right of the cursor2 . The toolbar has two icons: the first is called Settings…, where all the cool stuff lives; the second is called Disable Breakpoint, which is very useful if you have customized the breakpoint3. If you click the Settings… button, you will see an inline dialog with two checkboxes; Conditions and Actions4.

If you check the first box, Conditions, you will be presented with various fields for specifying a condition under which the breakpoint fires. There are three types of condition;

  1. Conditional Expression
  2. Hit Count
  3. Filter
Adding a condition to a breakpoint

Conditional Expression conditions allow you to specify a condition based on variables within your code. You can break on when a specific condition is met, or when a condition changes (this allows you to break when a variable changes value, for example).

Hit Count conditions allow you to break once after the breakpoint has been hit a specific number of times (such as on the fifth index of an array in a loop), every time after the breakpoint has been hit a specific number of times, or every time the hit count is a multiple of a specific number (like every other hit, or once every five hits).

Filter conditions allow you to specify filters based on process, thread, and machine names, and process and thread identifiers.

Conditional breakpointYou can add multiple conditions to a breakpoint, which all have to match for the breakpoint to fire. When a condition is applied to a breakpoint, the red circle will have a white plus symbol inside it.

Adding output text to a breakpoint

If you check the Actions box, you can specify text to be outputted when the breakpoint fires. By default, a checkbox named Continue Execution will be checked because, usually, if specifying output text, you want a tracepoint rather than a breakpoint. However, if you want to break and output text, you can uncheck this additional checkbox.

Non-breaking breakpoint (aka tracepoint)When a breakpoint is set to continue execution, the red circle changes into a red diamond. If a condition is also applied, the diamond has a white cross Conditional non-breaking breakpoint (aka tracepoint)in it.

If you use the Oz-code extension for Visual Studio, tracepoints are given some additional support with a quick action to add a tracepoint and a tracepoint viewer that shows you just tracepoints.

Function Breakpoints

Adding a function breakpoint

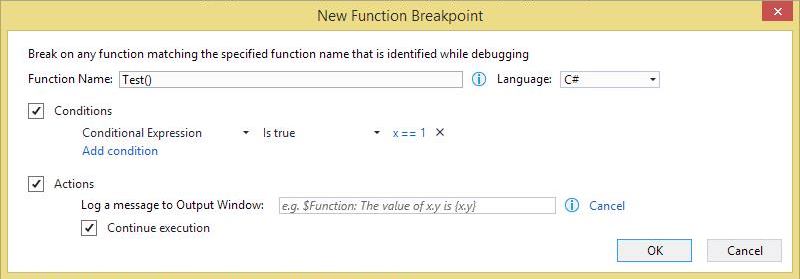
So far, we've looked at traditional breakpoints that are set on specific lines of code. Function breakpoints are set against function names. To add a function point, use the Visual Studio menu to go to Debug→New Breakpoint→Function Breakpoint…5. Selecting this will show a dialog where you can specify the function name (qualifying it as you require), and the language to which the breakpoint applies. You can also specify conditions and actions as with any other breakpoint.

In Conclusion…

Visual Studio is a complex development environment, which unfortunately leads to some of its cooler features being harder to find. I hope you find this introduction to breakpoint superpowers useful, if you do or if you have more Visual Studio debugging tips, I'd love to hear from you in the comments.

Today's featured image is "Debugging the Computer" by Jitze Couperus. The image is licensed under CC BY 2.0. Other than being resized, the image has not been modified.

  1. yay, fixed it… []
  2. This also appears if you hover over an existing breakpoint in the margin []
  3. Deleting the breakpoint would also delete any customization, but disabling does not []
  4. This dialog can also be reached by right-clicking the breakpoint and choosing either Conditions… or Actions… or by hitting Alt+F9, C; the only difference here is that one of the two checkboxes will get checked automatically []
  5. You can also add one via the keyboard with Alt+F9, B or the New… dropdown in the Breakpoints tool window []

Debugging in LINQPad

If you have been reading my blog over the last few months you will no doubt be aware that I am a regular user of LINQPad. I do not have any commercial involvement with LINQPad nor its creators, I just really like it. Recently, I decided to try out the latest release, which adds integrated debugging to the already feature rich tool. This amazingly powerful new feature adds yet another reason why this application should be in every developer's arsenal, regardless of experience and ability (it is a great learning tool for students). Here is a brief overview of this new feature, which is available with the premium license (currently on sale for $85 at time of writing; it may not be the case as you are reading this).

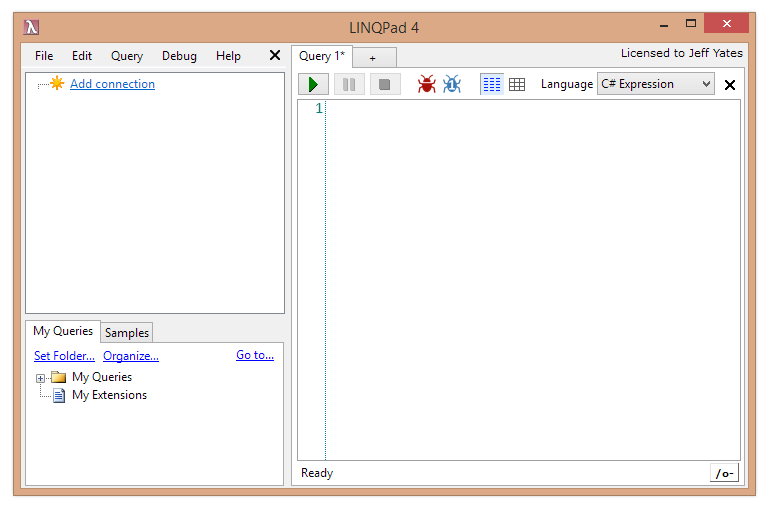
When running the latest LINQPad, the debugging feature adds some new buttons to the familiar toolbar. All the debugging features are available for both statement and program-based queries in C#, VB, and F# (not expressions or SQL languages). The first new button is the `Pause` button, also known as `Break`. This works as you might expect, pausing the current code execution. The other two are to specify how exceptions should be handled, informing  the debugger to break on unhandled exceptions and when exceptions are thrown. Breakpoints can be added by clicking in the margin to the left of the code or pressing `F9` when the caret is on the desired line.  When a breakpoint is active on a line, it is indicated as a large red circle. For those who regularly use Visual Studio, the breakpoint and general debugger experience will be familiar.

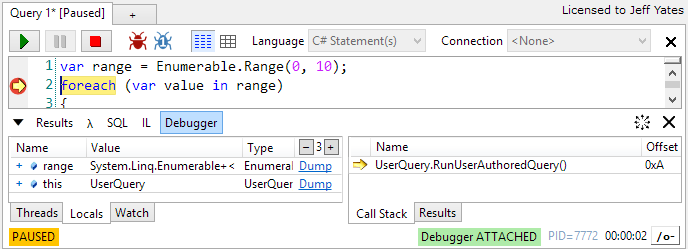
Pressing `F5` will run the query (or selected lines) as usual, but now, any breakpoints set on executing lines will cause the code to break. At this point, LINQPad will reveal some familar and not-so-familiar tools for debugging the code. General status information is displayed at the bottom of the LINQPad window, showing things like whether the code is executing or paused, whether the debugger is attached or not, and the process ID.

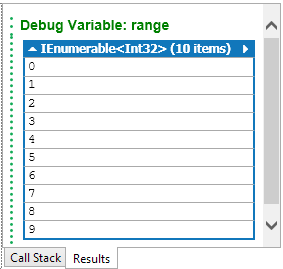
The next code statement to execute is highlighted in the code with a yellow arrow in the margin (in this case, overlaid on the breakpoint circle), and the code highlighted in yellow. In the lower left portion of the screen, we can see local variables and executing threads. We can also set up our own watches as necessary. Any objects in the `Locals` and `Watch` tabs can be expanded using the `+` glyph to reveal their constituent values. As in Visual Studio, these tabs allow the expansion of just-in-time LINQ queries so you can delve into the deep dark secrets of your code. However, you can also take advantage of LINQPad's fantastic dump feature and dump any value out to the `Results` tab on the right. If you want to control how far down the object graph a dump will go, you can modify the `Dump Depth` using the `+` and `-` controls in the column header.

The `Dump` output for the `range` variable
Specifying the depth of the dump

For more information on LINQPad and its many features, check out the LINQPad website (http://linqpad.net). In my opinion, whether you use the free version or one of the paid upgrades, you will have one of the best coding utilities available for .NET.

Writing A Simple Slack Bot With Node slack-client

Last week, we held our first CareEvolution hackathon of 2015. The turn out was impressive and a wide variety of projects were undertaken, including 3D printed cups, Azure-based machine learning experiments, and Apple WatchKit prototypes. For my first hackathon project of the year, I decided to tinker with writing a bot for Slack. There are many ways to integrate custom functionality into Slack including an extensive API. I decided on writing a bot and working with the associated API because there was an existing NodeJS1 client wrapper, `slack-client`2. Using this client wrapper meant I could get straight to the functionality of my bot rather than getting intimate with the API and JSON payloads.

I ended up writing two bots. The first implemented the concept of `@here` that we had liked in HipChat and missed when we transitioned to Slack (they have `@channel`, but that includes offline people). The second implemented a way of querying our support server to get some basic details about our deployments without having to leave the current chat, something that I felt might be useful to our devops team. For this blog, I will concentrate on the simpler and less company-specific first bot, which I named `here-bot`.

The requirement for here-bot is simple:

When a message is sent to `@here` in a channel, notify only online members of the channel, excluding bots and the sender

In an ideal situation, this could be implemented like `@channel` and give users the ability to control how they get notified, but I could not identify an easy way to achieve that inside or outside of a bot (I raised a support request to get it added as a Slack feature). Instead, I felt there were two options:

  1. Tag users in a message back to the channel from `here-bot`
  2. Direct message the users from `here-bot` with links back to the channel

I decided on the first option as it was a little simpler.

To begin, I installed the client wrapper using `npm`:

npm install slack-client

The `slack-client` package provides a simple wrapper to the Slack API, making it easy to make a connection and get set up for handling messages. I used their sample code to guide me as I created the basic skeleton of `here-bot`.

var Slack = require('slack-client');

var token = 'MY SUPER SECRET BOT TOKEN';

var slack = new Slack(token, true, true);

slack.on('open', function () {
    var channels = Object.keys(slack.channels)
        .map(function (k) { return slack.channels[k]; })
        .filter(function (c) { return c.is_member; })
        .map(function (c) { return c.name; });

    var groups = Object.keys(slack.groups)
        .map(function (k) { return slack.groups[k]; })
        .filter(function (g) { return g.is_open && !g.is_archived; })
        .map(function (g) { return g.name; });

    console.log('Welcome to Slack. You are ' + slack.self.name + ' of ' + slack.team.name);

    if (channels.length > 0) {
        console.log('You are in: ' + channels.join(', '));
    }
    else {
        console.log('You are not in any channels.');
    }

    if (groups.length > 0) {
       console.log('As well as: ' + groups.join(', '));
    }
});

slack.login();

This code defines a connection to Slack using the token that is assigned to our bot by the bot integration setup on Slack's website. It then sets up a handler for the `open` event, where the groups and channels to which the bot belongs are output to the console. In Slack, I could see the bot reported as being online while the code executed and offline once I stopped execution. As bots go, it was not particularly impressive, but it was amazing how easy it was to get the bot online. The `slack-client` package made it easy to create a connection and iterate the bot's channels and groups, including querying whether the groups were open or archived.

For the next step, I needed to determine when my bot was messaged. It turns out that when a bot is the member of a channel (including direct message), it gets notified on each message entered in that channel. In our client code, we can get these messages using the `message` event.

slack.on('message', function(message) {
    var channel = slack.getChannelGroupOrDMByID(message.channel);
    var user = slack.getUserByID(message.user);

    if (message.type === 'message') {
        console.log(channel.name + ':' + user.name + ':' + message.text);
    }
});

Using the `slack-client`'s useful helper methods, I turned the message channel and user identifiers into channel and user objects. Then, if the message is a message (it turns out there are other types such as edits and deletions), I send the details of the message to the console.

With my bot now listening to messages, I wanted to determine if a message was written at the bot and should therefore alert the channel users. It turns out that when a message references a user, it actually embeds the user identifier in place of the displayed `@here` text. For example, a message that appears in the Slack message window as:

@here: Anyone know how to write a Slack bot?

Is sent to the `message` event as something like3:

<@U099999>: Anyone know how to write a Slack bot?

It turns out that this special code is how a link to a user or channel is embedded into a message. So, armed with this knowledge and knowing that I would want to mention users, I wrote a couple of helper methods: the first to generate a user mention embed code from a user identifier, the second to determine if a message was targeted at a specific user (i.e. that it began with a reference to that user).

var makeMention = function(userId) {
    return '<@' + userId + '>';
};

var isDirect = function(userId, messageText) {
    var userTag = makeMention(userId);
    return messageText &&
           messageText.length >= userTag.length &&
           messageText.substr(0, userTag.length) === userTag;
};

Using these helpers and the useful `slack.self` property, I could then update the `message` handler to only log messages that were sent directly to here-bot.

slack.on('message', function(message) {
    var channel = slack.getChannelGroupOrDMByID(message.channel);
    var user = slack.getUserByID(message.user);

    if (message.type === 'message' && isDirect(slack.self.id, message.text)) {
        console.log(channel.name + ':' + user.name + ':' + message.text);
    }
});

The final stage of the bot was to determine who was present in the channel and craft a message back to that channel mentioning those online users. This turned out to be a little trickier than I had anticipated. The `channel` object in `slack-client` provides an array of user identifiers for its members; `channel.members`. This array contains all users present in that channel, whether online or offline, bot or human. To determine details about each user, I would need the user object. However, the details for each Slack user are provided by the `slack.users` property. I needed to join the channel member identifiers with the Slack user details to get a collection of users for the channel. Through a little investigative debugging4, I learned that `slack.users` was not an array of user objects, but instead an object where each property name is a user identifier. At this point, I wrote a method to get the online human users for a channel.

var getOnlineHumansForChannel = function(channel) {
    if (!channel) return [];

    return (channel.members || [])
        .map(function(id) { return slack.users[id]; }
        .filter(function(u) { return !!u && !u.is_bot && u.presence === 'active'; });
};

Finally, I crafted a message and wrote that message to the channel. In this update of my `message` event handler, I have trimmed the bot's mention from the start of the message before creating an array of user mentions, excluding the user that sent the message. The last step calls `channel.send` to output a message in the channel that mentions all the online users for that channel and repeats the original message text.

slack.on('message', function(message) {
    var channel = slack.getChannelGroupOrDMByID(message.channel);
    var user = slack.getUserByID(message.user);

    if (message.type === 'message' && isDirect(slack.self.id, message.text)) {
        var trimmedMessage = message.text.substr(makeMention(slack.self.id).length).trim();
        
        var onlineUsers = getOnlineHumansForChannel(channel)
            .filter(function(u) { return u.id != user.id; })
            .map(function(u) { return makeMention(u.id); });
        
        channel.send(onlineUsers.join(', ') + '\r\n' + user.real_name + 'said: ' + trimmedMessage);
    }
});

Conclusion

Example

My `@here` bot is shown below in its entirety for those that are interested. It was incredibly easy to write thanks to the `slack-client` package, which left me with hackathon time to spare for a more complex bot. I will definitely be using `slack-client` again.

var Slack = require('slack-client');

var token = 'MY SUPER SECRET BOT TOKEN';

var slack = new Slack(token, true, true);

var makeMention = function(userId) {
    return '<@' + userId + '>';
};

var isDirect = function(userId, messageText) {
    var userTag = makeMention(userId);
    return messageText &&
           messageText.length >= userTag.length &&
           messageText.substr(0, userTag.length) === userTag;
};

var getOnlineHumansForChannel = function(channel) {
    if (!channel) return [];

    return (channel.members || [])
        .map(function(id) { return slack.users[id]; }
        .filter(function(u) { return !!u && !u.is_bot && u.presence === 'active'; });
};

slack.on('open', function () {
    var channels = Object.keys(slack.channels)
        .map(function (k) { return slack.channels[k]; })
        .filter(function (c) { return c.is_member; })
        .map(function (c) { return c.name; });

    var groups = Object.keys(slack.groups)
        .map(function (k) { return slack.groups[k]; })
        .filter(function (g) { return g.is_open && !g.is_archived; })
        .map(function (g) { return g.name; });

    console.log('Welcome to Slack. You are ' + slack.self.name + ' of ' + slack.team.name);

    if (channels.length > 0) {
        console.log('You are in: ' + channels.join(', '));
    }
    else {
        console.log('You are not in any channels.');
    }

    if (groups.length > 0) {
       console.log('As well as: ' + groups.join(', '));
    }
});

slack.on('message', function(message) {
    var channel = slack.getChannelGroupOrDMByID(message.channel);
    var user = slack.getUserByID(message.user);

    if (message.type === 'message' && isDirect(slack.self.id, message.text)) {
        var trimmedMessage = message.text.substr(makeMention(slack.self.id).length).trim();
        
        var onlineUsers = getOnlineHumansForChannel(channel)
            .filter(function(u) { return u.id != user.id; })
            .map(function(u) { return makeMention(u.id); });
        
        channel.send(onlineUsers.join(', ') + '\r\n' + user.real_name + 'said: ' + trimmedMessage);
    }
});

slack.login();


  1. or ioJS, if you would prefer []
  2. I find hackathons to be a bit like making a giant pile of sticks in the middle of a desert; it's an opportunity to get creative and build something where there seems to be nothing…using sticks…or in my case, a Node package and Slack []
  3. I totally made up the user identifier for this example []
  4. I used WebStorm 9 from JetBrains to debug my Node code, a surprisingly easy and pleasant experience []

Some of my favourite tools

Update: This post has been updated to recognise that CodeLineage is now maintained by Hippo Camp Software and not Red Gate Software as was originally stated.

If you know me, you might well suspect this post is about some of the idiots I know, but it is not, this is entirely about some of the tools I use in day-to-day development. This is by no means an exhaustive list, nor is it presented in any particular order. However, assuming you are even a little bit like me as a developer, you will see a whole bunch of things you already use, but hopefully there is at least one item that is new to you. If you do find something new and useful here, or you have some suggestions of your own, please feel free to post a comment.

OzCode

OzCode is an add-in for Visual Studio that provides some debugging super powers like collection searching, adding computed properties to objects, pinning properties so that you don't have to go hunting in the object tree, simpler tracepoint creation, and a bunch more. I first tried this during beta and was quickly sold on its value. Give the 30-day trial a chance and see if it works for you.

Resharper

This seems to be a staple for most C# developers. I was a late-comer to using this tool and I am not sure I like it for the same reasons as everyone else. I actually love Resharper for its test runner, which is a more performant alternative to Visual Studio's built-in Test Explorer, and the ability to quickly change file names to match the type they contain. However, it has a lot of features, so while this is not free, give the trial a chance and see if it fits.

Web Essentials

Another staple for many Visual Studio developers, Web Essentials provides lots of support for web-related development including enhanced support for JavaScript, CSS, CoffeeScript, LESS, SASS, MarkDown, and much more. If you do any kind of web development, this is essential1.

LinqPad

I was late to the LinqPad party, but gave it a shot during Ann Arbor Give Camp 2013 and within my first hour or two of using it, dropped some cash on the premium version (it is very inexpensive for what you get). Since then, whether it is hacking code or hacking databases, I have been using LinqPad as my standard tool for hacking.

For code, it does not have the overhead of creating projects and command line, WinForms or WPF wrapper tools that you would have to do in Visual Studio. For databases, LinqPad gives you the freedom to use SQL, C#, F# or VB for querying and manipulating your database as well as support for many different data sources beyound just SQL Server, providing an excellent alternative to SQL Management Studio.

LinqPad is free, but you get some cool features if you go premium, and considering the sub-$100 price, it is totally worth it.

JustDecompile

When Red Gate stopped providing Reflector for free, JetBrains and Telerik stepped up with their own free decompilers for poking around inside .NET code. These are often invaluable when tracking down obscure bugs or wanting to learn more about the code that is running when you did not write it. While JetBrains' dotPeek is useful, I have found that JustDecompile from Telerik has a better feature set (including showing MSIL, which I could not find in dotPeek).

Chutzpah

Chutzpah is a test runner for JavaScript unit tests and is available as a Nuget package. It supports tests written for Jasmine, Mocha, and QUnit, as well as a variety of languages including CoffeeScript and TypeScript. There are also two Visual Studio extensions to provide Test Explorer integration and a handy context menu. I find the context menu most useful out of these.

Chutzpah is a great option when you cannot leverage a NodeJS-based tool-chain like Grunt or Gulp, or some other non-Visual Studio build process.

CodeLineage

CodeLineage is a free Visual Studio extension from Hippo Camp Software2. Regardless of your source control provider, CodeLineage provides you with a simple interface for comparing different points in the history of a given file. The simple interface makes it easy to select which versions to compare. I do not use this tool often, but when I need it, it is fantastic.

FileNesting

This Visual Studio extension from the developer of Web Essentials makes nesting files under one another a breeze. You can set up automated nesting rules or perform nesting manually.

I like to keep types separated by file when developing in C#. Files are cheap and it helps discovery when navigating code. However, this sometimes means using partial classes to keep nested types separate, so to keep my solution explorer tidy, I edit the project files and nest source code files. I also find this useful for Angular directives, allowing me to apply the familiar pattern  of organizing code-behind under presentation by nesting JavaScript files under the template HTML.

Whether you have your own nesting guidelines or want to ensure generated code is nested under its corresponding definition (such as JavaScript generated from CoffeeScript), this extension is brilliant.

Switch Startup Project

Ever hit F5 to debug only to find out you tried to start a non-executable project and have to hunt for the right project in the Solution Explorer? This used to happen to me a lot, but not since this handy extension, which adds a drop down to the toolbar where I can select the project I want to be my startup project. A valuable time saver.

MultiEditing

Multi-line editing has been a valuable improvement in recent releases of Visual Studio, but it has a limitation in that you can only edit contiguous lines at the same column location. Sometimes, you want to edit multiple lines in a variety of locations and with this handy extension, you can. Just hold ALT and click the locations you want to multi-edit, then type away.

Productivity Power Tools

Productivity Power Tools for Visual Studio have been a staple extension since at least Visual Studio 2008. Often the test bed of features that eventually appear as first class citizens in the Visual Studio suite, Productivity Power Tools enhances the overall Visual Studio experience.

The current version for Visual Studio 2013 provides support for colour printing, custom document tabs, copying as HTML, error visualization in the Solution Explorer, time stamps in the debug output margin, double-click to maximize and dock windows, and much more. This is a must-have for any Visual Studio user.

  1. yes, I went there []
  2. though it was maintained by Red Gate when I first started using it []