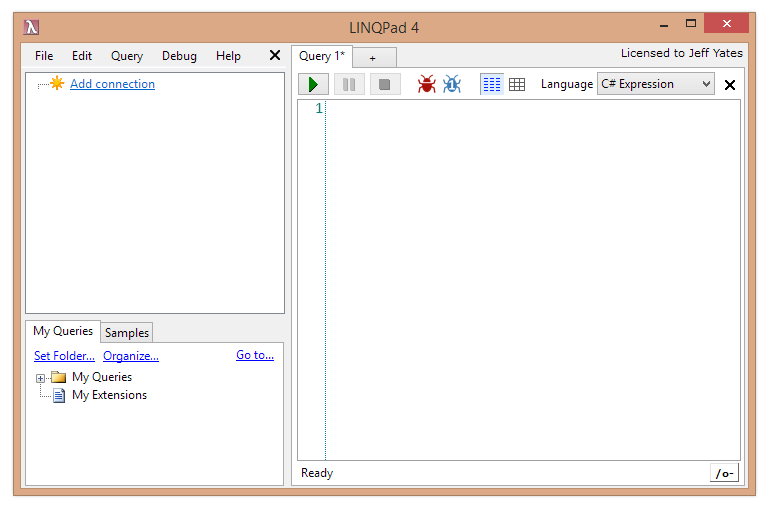
If you have been reading my blog over the last few months you will no doubt be aware that I am a regular user of LINQPad. I do not have any commercial involvement with LINQPad nor its creators, I just really like it. Recently, I decided to try out the latest release, which adds integrated debugging to the already feature rich tool. This amazingly powerful new feature adds yet another reason why this application should be in every developer's arsenal, regardless of experience and ability (it is a great learning tool for students). Here is a brief overview of this new feature, which is available with the premium license (currently on sale for $85 at time of writing; it may not be the case as you are reading this).
When running the latest LINQPad, the debugging feature adds some new buttons to the familiar toolbar. All the debugging features are available for both statement and program-based queries in C#, VB, and F# (not expressions or SQL languages). The first new button is the `Pause` button, also known as `Break`. This works as you might expect, pausing the current code execution. The other two are to specify how exceptions should be handled, informing the debugger to break on unhandled exceptions and when exceptions are thrown. Breakpoints can be added by clicking in the margin to the left of the code or pressing `F9` when the caret is on the desired line. When a breakpoint is active on a line, it is indicated as a large red circle. For those who regularly use Visual Studio, the breakpoint and general debugger experience will be familiar.
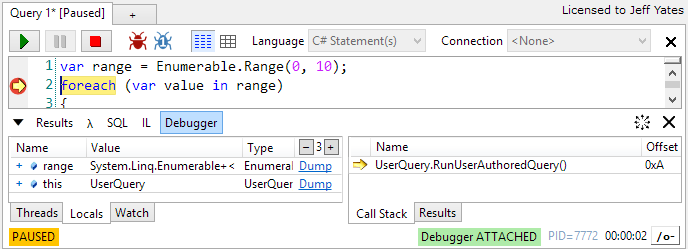
Pressing `F5` will run the query (or selected lines) as usual, but now, any breakpoints set on executing lines will cause the code to break. At this point, LINQPad will reveal some familar and not-so-familiar tools for debugging the code. General status information is displayed at the bottom of the LINQPad window, showing things like whether the code is executing or paused, whether the debugger is attached or not, and the process ID.

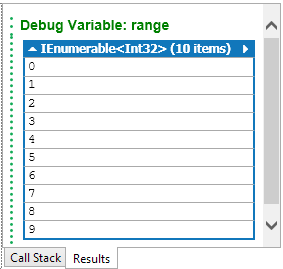
The next code statement to execute is highlighted in the code with a yellow arrow in the margin (in this case, overlaid on the breakpoint circle), and the code highlighted in yellow. In the lower left portion of the screen, we can see local variables and executing threads. We can also set up our own watches as necessary. Any objects in the `Locals` and `Watch` tabs can be expanded using the `+` glyph to reveal their constituent values. As in Visual Studio, these tabs allow the expansion of just-in-time LINQ queries so you can delve into the deep dark secrets of your code. However, you can also take advantage of LINQPad's fantastic dump feature and dump any value out to the `Results` tab on the right. If you want to control how far down the object graph a dump will go, you can modify the `Dump Depth` using the `+` and `-` controls in the column header.


For more information on LINQPad and its many features, check out the LINQPad website (http://linqpad.net). In my opinion, whether you use the free version or one of the paid upgrades, you will have one of the best coding utilities available for .NET.


