We've all been there: we step through our code with breakpoints and it works just fine, but run it without ever hitting a breakpoint and our code explodes in a fiery ball of enigmatic failure. Perhaps the failure only happens after the 1000th call of a method, when a variable is set to a specific value, or the value of a variable changes. These bugs can be hard to investigate without actually modifying the software that has the bug, which then means you are no longer debugging the same software that had the bug and might mean the bug disappears1.
Thankfully, Visual Studio has our backs on tracking down some of these more obscure bugs. Visual Studio allows us to modify our breakpoints to only break on certain conditions (like the 5th loop iteration, or when a file is open), to output text to the debug window, or to just output text and not actually break into our code. We can even create breakpoints that break on any function that matches a name we provide, just in case you don't even know which code it's actually calling.
Though I discuss the 2015 experience, the features themselves have been around for quite some time. I would not be surprised if this were the first time you had heard about these breakpoint settings, they have always been somewhat hidden away from the primary workflow. Even now, with the updated user experience, they are not obvious unless you go exploring. If you want to see how to use them in your variant of Visual Studio, or get more information on breakpoints in 2015, MSDN has you covered (2003|2005|2008|2010|2012|2013|2015).
Conditions and Actions
![]()
Let's begin by taking a look at adding conditions and tracepoints. When you add a breakpoint to a line of code, either by using the F9 keyboard shortcut or left-clicking in the code margin, a little toolbar appears to the upper right of the cursor2 . The toolbar has two icons: the first is called Settings…, where all the cool stuff lives; the second is called Disable Breakpoint, which is very useful if you have customized the breakpoint3. If you click the Settings… button, you will see an inline dialog with two checkboxes; Conditions and Actions4.
If you check the first box, Conditions, you will be presented with various fields for specifying a condition under which the breakpoint fires. There are three types of condition;
- Conditional Expression
- Hit Count
- Filter

Conditional Expression conditions allow you to specify a condition based on variables within your code. You can break on when a specific condition is met, or when a condition changes (this allows you to break when a variable changes value, for example).
Hit Count conditions allow you to break once after the breakpoint has been hit a specific number of times (such as on the fifth index of an array in a loop), every time after the breakpoint has been hit a specific number of times, or every time the hit count is a multiple of a specific number (like every other hit, or once every five hits).
Filter conditions allow you to specify filters based on process, thread, and machine names, and process and thread identifiers.
![]() You can add multiple conditions to a breakpoint, which all have to match for the breakpoint to fire. When a condition is applied to a breakpoint, the red circle will have a white plus symbol inside it.
You can add multiple conditions to a breakpoint, which all have to match for the breakpoint to fire. When a condition is applied to a breakpoint, the red circle will have a white plus symbol inside it.

If you check the Actions box, you can specify text to be outputted when the breakpoint fires. By default, a checkbox named Continue Execution will be checked because, usually, if specifying output text, you want a tracepoint rather than a breakpoint. However, if you want to break and output text, you can uncheck this additional checkbox.
![]() When a breakpoint is set to continue execution, the red circle changes into a red diamond. If a condition is also applied, the diamond has a white cross
When a breakpoint is set to continue execution, the red circle changes into a red diamond. If a condition is also applied, the diamond has a white cross ![]() in it.
in it.
If you use the Oz-code extension for Visual Studio, tracepoints are given some additional support with a quick action to add a tracepoint and a tracepoint viewer that shows you just tracepoints.
Function Breakpoints

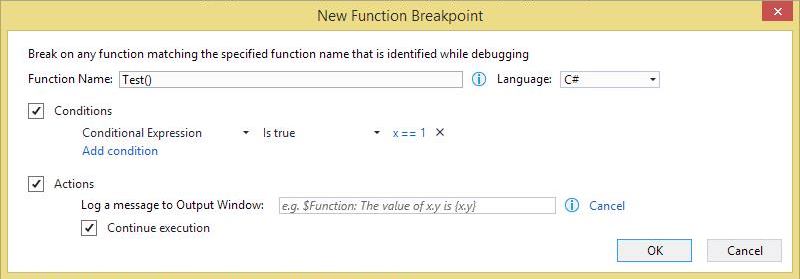
So far, we've looked at traditional breakpoints that are set on specific lines of code. Function breakpoints are set against function names. To add a function point, use the Visual Studio menu to go to Debug→New Breakpoint→Function Breakpoint…5. Selecting this will show a dialog where you can specify the function name (qualifying it as you require), and the language to which the breakpoint applies. You can also specify conditions and actions as with any other breakpoint.
In Conclusion…
Visual Studio is a complex development environment, which unfortunately leads to some of its cooler features being harder to find. I hope you find this introduction to breakpoint superpowers useful, if you do or if you have more Visual Studio debugging tips, I'd love to hear from you in the comments.
Today's featured image is "Debugging the Computer" by Jitze Couperus. The image is licensed under CC BY 2.0. Other than being resized, the image has not been modified.
- yay, fixed it… [↩]
- This also appears if you hover over an existing breakpoint in the margin [↩]
- Deleting the breakpoint would also delete any customization, but disabling does not [↩]
- This dialog can also be reached by right-clicking the breakpoint and choosing either Conditions… or Actions… or by hitting Alt+F9, C; the only difference here is that one of the two checkboxes will get checked automatically [↩]
- You can also add one via the keyboard with Alt+F9, B or the New… dropdown in the Breakpoints tool window [↩]


