This post is the first part of a two part series.
I love working with Silverlight but once in a while I get it wrong and I, or worse, a user experiences a crash incident. I believe it is important for developers to acknowledge that incidents will occur and to include incident handling and reporting as first class citizens in the software we write. It benefits both us and our users by providing both a graceful degradation of our application and a source of feedback regarding application stability and bugs.
In this and subsequent posts, I want to take a look at the functionality a new Silverlight project includes for handling and reporting incidents, and then build upon it to give us some top notch error handling in our Silverlight applications.
So, let's start with the basics1
Create a new Silverlight application (including a companion ASP.NET web application or website) and you'll get two flavours of error handling: the first reports errors when you're not debugging your application and the second reports errors when you are2. When there is no debugger attached, errors are reported to the DOM via the HTML bridge. This all happens in App.xaml.cs via an event handler for the Application.UnhandledException event, which is subscribed in the class constructor. The event handler checks whether the debugger is attached and if it is not, it sends the error to the DOM via the cunningly-named ReportErrorToDOM method. The comments in Application_UnhandledException explain what is happening. Also, note that the event is being marked as handled, meaning our application won't stop running just because of this pesky exception.
private void Application_UnhandledException(object sender, ApplicationUnhandledExceptionEventArgs e)
{
    // If the app is running outside of the debugger then report the exception using
    // the browser's exception mechanism. On IE this will display it a yellow alert
    // icon in the status bar and Firefox will display a script error.
    if (!System.Diagnostics.Debugger.IsAttached)
    {
        // NOTE: This will allow the application to continue running after an exception has been thrown
        // but not handled.
        // For production applications this error handling should be replaced with something that will
        // report the error to the website and stop the application.
        e.Handled = true;
        Deployment.Current.Dispatcher.BeginInvoke(delegate
        {
            ReportErrorToDOM(e);
        });
    }
}
And a quick look at ReportErrorToDOM shows us the HTML bridge is being used to evaluate some JavaScript that will throw an exception inside the hosting browser.
private void ReportErrorToDOM(ApplicationUnhandledExceptionEventArgs e)
{
    try
    {
        string errorMsg = e.ExceptionObject.Message + e.ExceptionObject.StackTrace;
        errorMsg = errorMsg.Replace('"', '\'').Replace("\r\n";, @"\n");

        System.Windows.Browser.HtmlPage.Window.Eval(
            "throw new Error(\"Unhandled Error in Silverlight Application " + errorMsg + "\");");
    }
    catch (Exception)
    {
    }
}
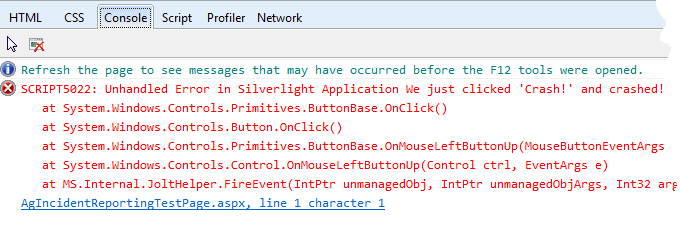
If you try this and you're using a recent browser, it's very likely that you won't even notice anything happened. I put a button on my vanilla application and tied that to a click-event handler that throws an InvalidOperationException exception. Clicking it in IE9 gave me nothing until I pressed F12, viewed the Console in the developer tools and tried again. In some older browsers, a dialog box may appear indicating a scripting error.

I'll leave it as an exercise for you to go and see exactly what this looks like in your browser of choice, but I think we can all agree that with error handling like this our users must surely feel a warm fuzzy glow (especially with our hidden, cryptic error message and an application that continues running, unfettered by the potentially fatal bug lurking within). In fact, if the HTML bridge is disabled3, there isn't even a cryptic error message!
However, you'll be pleased to read that things are almost ever so very slightly better different when we have the debugger attached.
Attaching the debugger
The exception handler we just looked at only reports the error to the DOM when the debugger is not attached (and the HTML bridge is enabled). When the debugger is attached, the handler does nothing at all and the exception goes unhandled by our application. So what happens next?
Well, when an unhandled exception leaves our application, the Silverlight host looks for a JavaScript method assigned to the onError parameter. If there is such a method, it calls that and stops the application. The default handler is defined for us in the auto-generated HTML and ASPX. You can see its assignment in the default HTML and ASPX pages generated for us when we created our Silverlight application.
<object data="data:application/x-silverlight-2," type="application/x-silverlight-2" width="100%" height="100%">
    <param name="source" value="ClientBin/AgIncidentReporting.xap"/>
    <param name="onError" value="onSilverlightError" />
    <param name="background" value="white" />
    <param name="minRuntimeVersion" value="4.0.50826.0" />
    <param name="autoUpgrade" value="true" />
    <a href="http://go.microsoft.com/fwlink/?LinkID=149156&v=4.0.50826.0" style="text-decoration:none">
        <img src="http://go.microsoft.com/fwlink/?LinkId=161376" alt="Get Microsoft Silverlight" style="border-style:none"/>
    </a>
</object>
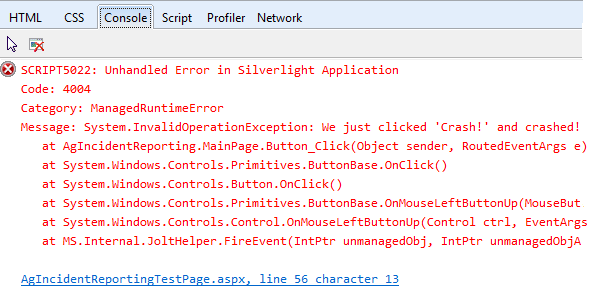
The default JavaScript handler generates an error similar to the one we get without the debugger, but with a few extra details4. Unfortunately, just like when the debugger isn't attached, disabling the HTML bridge (or running out-of-browser) also disables the error being reported.

The story so far…
In this introduction to Silverlight incident handling we have seen that, out of the box, we get some basic reporting that in a release scenario, will allow the application to continue running and will output a stack trace in the console5 but, when debugging, will stop the application and output a stack trace plus the added bonus of some extra details5.
I think you will agree, this is not a first class system for handling errors. Of course, all is not lost and in the next post we will look at how we can expand this error handling to be more helpful to both us and our users, perhaps even coping without the HTML bridge. That said, if this is all you use, I recommend deleting the code from App.xaml.cs so that the "debugger attached" style handling is used for all scenarios6. At least that way, when your application crashes, the user won't be able to continue using the application in blissful ignorance of whatever dangers lurk beneath.
- More detailed information on error handling in Silverlight, can be found here. [↩]
- I am using Visual Studio 2010 Professional SP1 with the Silverlight 4 SDK. All line numbers refer to a vanilla Silverlight project created using New Project in the File menu. [↩]
- You can disable the HTML bridge by adding <param name="enableHtmlAccess" value="false" /> to your Silverlight object declaration or by running your application out-of-browser. [↩]
- The Category value is only available if the development runtime is installed, but the Code value is provided with all runtimes. It indicates the type of error, which can be looked up here. [↩]
- If we're running in a browser with the HTML bridge enabled. [↩] [↩]
- Please don't actually use this as your error handling. Although it is in the most part, better for the user, your application will appear to crash a little more often as the onError handler gets called for more than just unhandled exceptions. [↩]
