⚙️ WordPress Site Health, cPanel, and Changing the PHP Version

Featured image created from photo by Webaroo.com.au on Unsplash

Every now and again, I click around the tools I use to see what new features have snuck in while I was not paying attention. I know many of you are terrified of clicking into the unknown and I don't blame you, but since I am willing to throw caution to the wind in this area, why not learn from me and resolve issues with all the confidence and less of the anxiety. Here is how I found and resolved a security issue in my WordPress blog through the use of inquisitive clicking around.
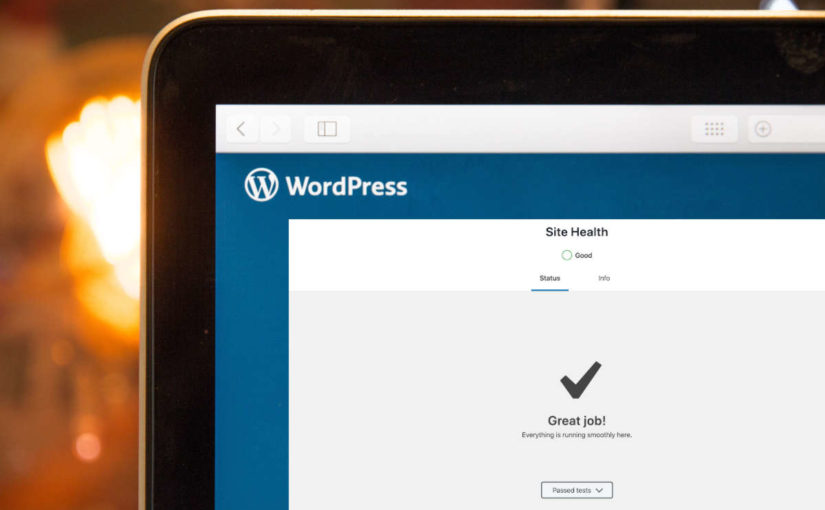
Site Health

When I was writing a post on some of the great tools I use to support my software development, I spent a large amount of time procrastinating, clicking around the tools I use to look at features that I had forgotten or had never even seen before. One of the things I discovered was the Site Health feature of WordPress, which I just now discovered was added in their 5.2 release. You can find Site Health under the Tools menu of the admin dashboard side panel; I highly recommend checking it out once in a while to make sure your WordPress installation is secure and performing well.

Selecting the Site Health tool takes you to a page that runs a variety of performance and security checks on your WordPress installation. You can see what things it is checking once the report has been produced. If all is well, everything passes. However, when I ran it, I got a warning about the version of PHP being used.

Screenshot of the Site Health page in WordPress showing the a yellow circle with the word "Should be improved", and the Status tab selected with the text "The site health check shows critical information about your WordPress configuration and items that require your attention.", "1 critical issue",  and "Your version of PHP (7.0.33) requires an update", as well as a collapsed section labelled "Passed tests".

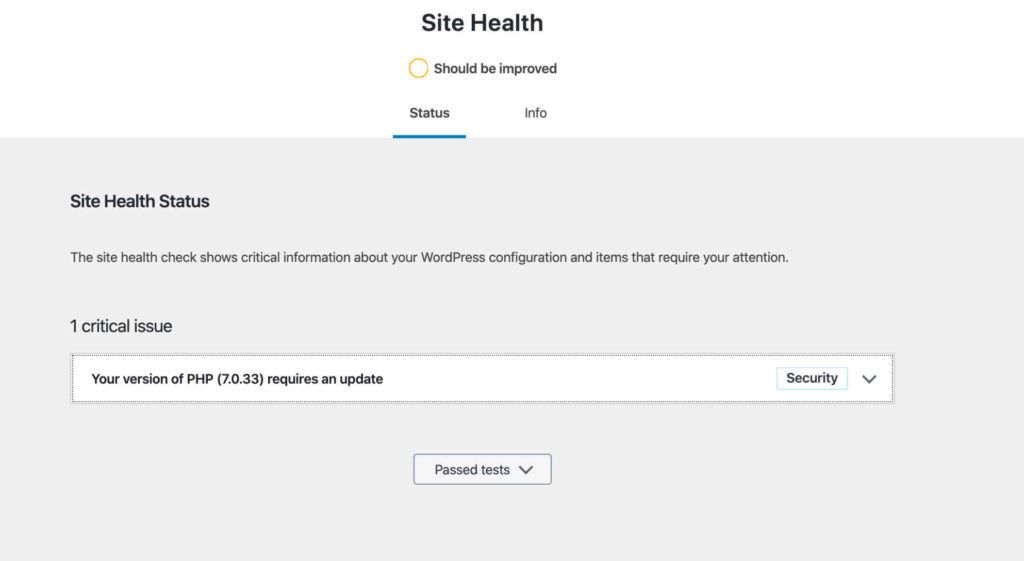
For those that do not know, PHP is the language with which WordPress is implemented. It is usually installed and managed by your hosting service and it is your hosting service where you must go to fix this problem.

Changing the version of PHP

My host is BlueHost, one of those recommended by WordPress and therefore, quite likely to be your host too. As with many WordPress hosts, BlueHost provide cPanel to manage things and it is in cPanel where the PHP issue can be fixed. However, I did not really know that until I started investigating, and as I said before, I like to click around the tools I use. This is how I found the screen where I could change the PHP version.

  1. Login to the site host account.
  2. Open cPanel
    In BlueHost, this is accessed by clicking the Advanced option in the sidebar.
    Screen grab of the BlueHost sidebar showing the Advanced option circled in red and indicated with an arrow
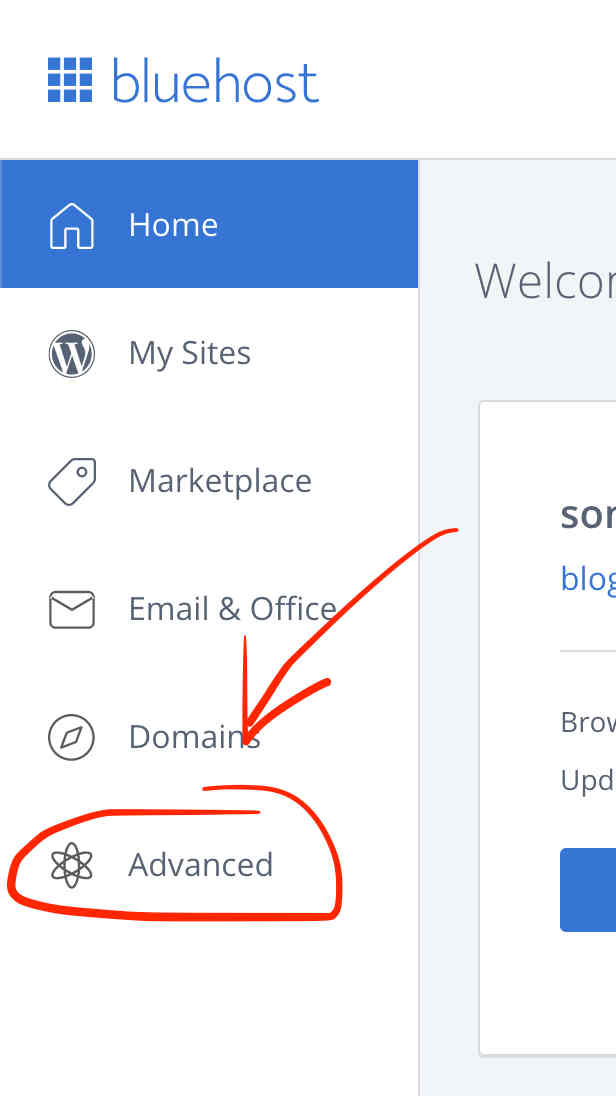
  3. Find and click the MultiPHP Manager option
    Screenshot of the BlueHost cPanel with PHP entered as a search term. The MultiPHP Manager option has been circled in red and indicated with a large red arrow.

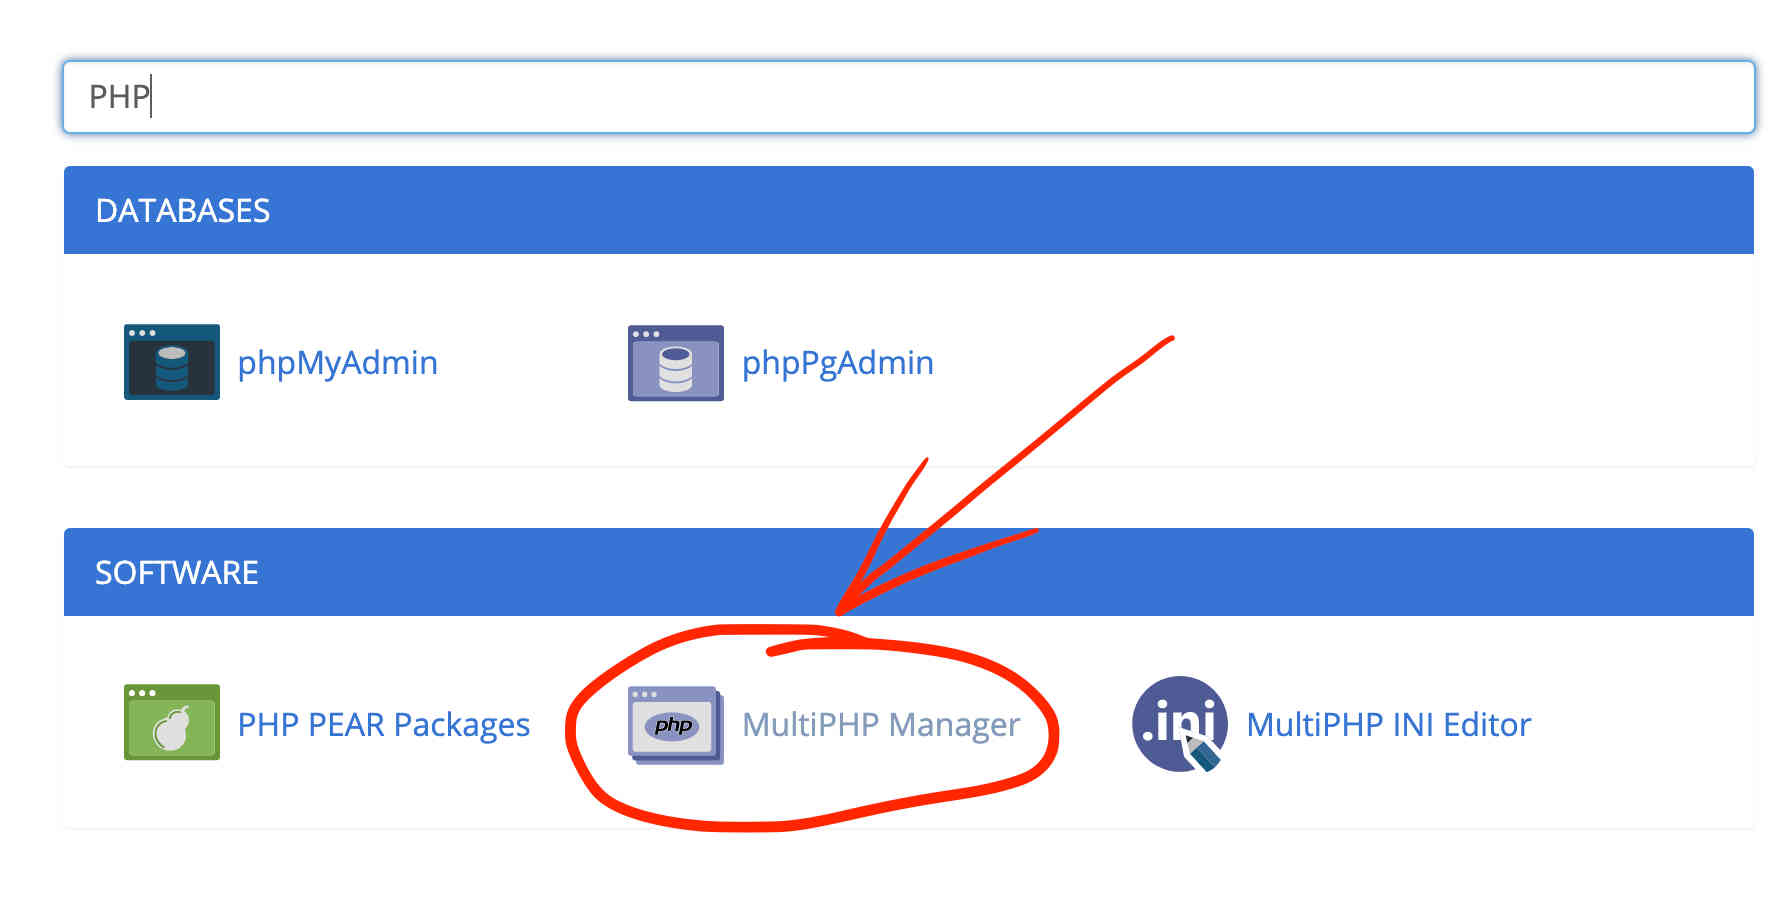
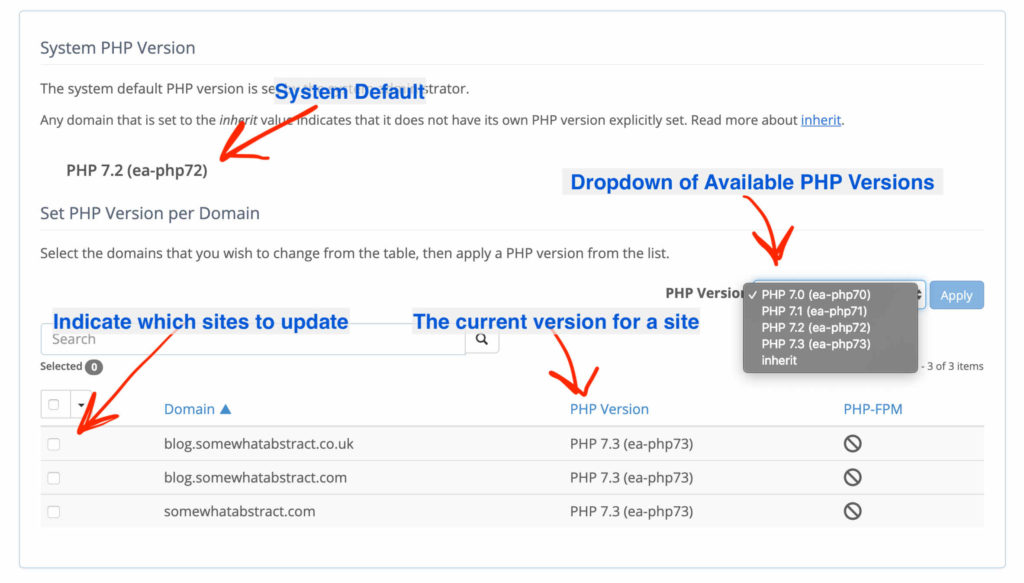
At this point, I saw the following screen.

Screenshot of the MultiPHP Manager screen in BlueHosts version of cPanel. It shows the System PHP Version of PHP 7.2 as well as my domains, with each saying they inherit this same version of PHP.

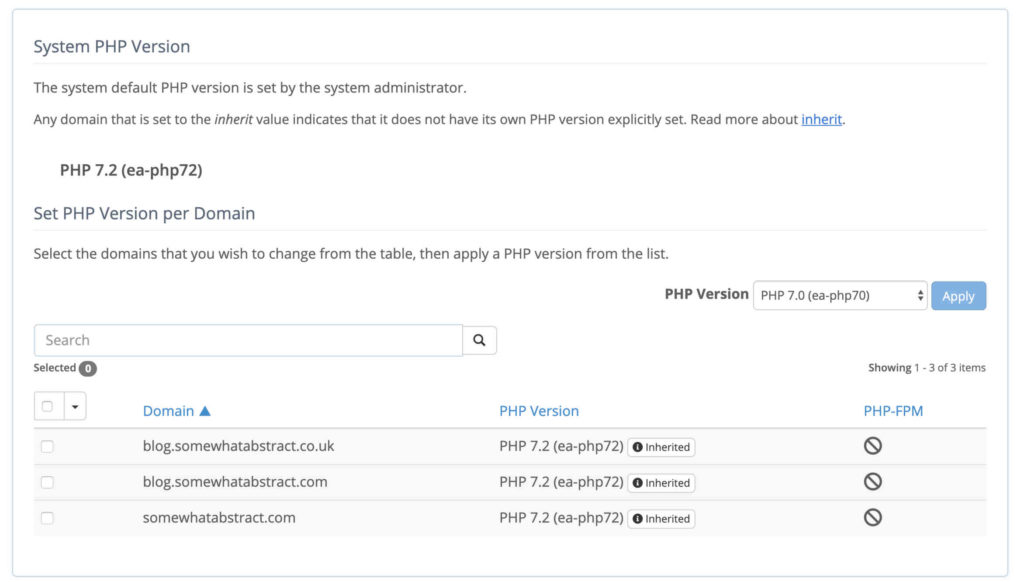
The system default version of PHP is shown at the top as 7.2, below that the list of my domains show that they inherit that same version. However, my WordPress Site Health said I was running only 7.0 of PHP. One of these is wrong, and I suspect that it is the information displayed in cPanel1.

I checked the boxes on the left so that I could change all my domains and then I chose 7.3 from the dropdown and clicked Apply. Here is what my MultiPHP Manager screen showed; I've annotated it to make a few things clearer.

Screenshot of the MultiPHP Manager screen in BlueHosts version of cPanel. Several areas have been indicated with red arrows and associated text; the System Default version, the dropdown of available PHP versions,

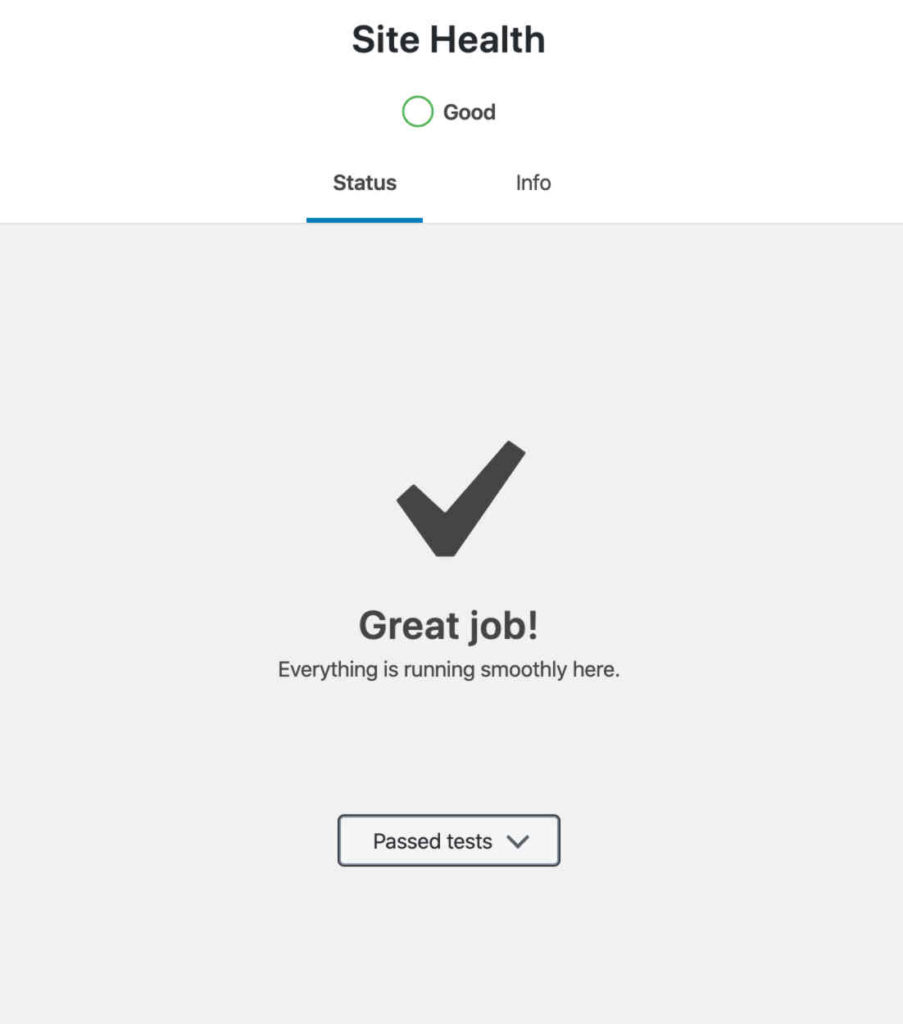
Verifying the change

At this point, returned to the WordPress Site Health page and refreshed it so that the health tests reran. After a few moments, the status was updated and everything was good2.

Screenshot of the Site Health page in WordPress showing the a green circle with the word "Good", and the Status tab selected with the text "Great job! Everything is running smoothly here." as well as a collapsed section labelled "Passed tests".

The Site Health feature is a great addition to the WordPress platform and though issues can be a little daunting, it often only takes a few moments to address them. Hopefully, my little journey into addressing this issue on my WordPress site is helpful; take a moment to check out your own site health.

Until next the time, I'll be me, you be you, and we will all have a lovely adventure. 👋🏻

  1. if I were to guess, I'd say there is a bug in cPanel where the UX assumes the system version is inherited but in reality, it is the lowest available version, which in this case is 7.0 []
  2. NOTE: You may need to refresh more than once in order to give the system time to reload on the new version of PHP that you have selected []

Monitoring My Blog Using Uptime Robot and IF

A week or two ago I discovered that my blog was not loading and I had no idea why it was throwing the 500 error code nor for how long it had been doing so. Having experienced this once or twice before, I went into my administration dashboard, stopped the website and application pool, then started them again. This fixed the immediate issue and my blog was back online, but I was not satisfied. I no longer wanted to discover this issue by chance so I went looking for ways to monitor my site.

I found several methods that could help, including one that uses my site's RSS feed as an IF trigger on IFTTT1, but I did not like this approach, so I looked around a little more. Eventually, after reading over a few options, I settled on using Uptime Robot. Uptime Robot allows up to 30 monitors on their free tier, which can be monitored at various frequencies down to every five minutes (if you want more monitors that are checked more frequently, you can look at their various paid options). Using this service, I not only will find out if my site goes down, but I also get stats over time on the reliability of my site.

Setting up a monitor on an HTTP(s) URL

Setting up a monitor was really easy and a quick test resulted in an email telling me the site was down, followed by another telling me it was back up once the site was restored. This was great although I felt an email was not enough. While Uptime Robot provides SMS support for sending alerts, they also provide you with an RSS feed on your account that syndicates your uptime alerts. Using an IF rule and the IF app on my phone, I was able to set up phone notifications for when my blog transitioned state between being up and down.

My Settings provides link to RSS feed for monitors

Trigger settings for IF rule to send notification to phone

I retested the monitor (this meant taking the site down and waiting until the next monitor cycle) and convinced myself that the IF trigger and action were working satisfactorily. Now, whenever my blog experiences a glitch, I will know within about five minutes or so. Not only that, but if it fixes itself before I get chance to do so, I will have some stats that I can use to determine if there is a fundamental issue with my site's up-time. Uptime Robot provides a dashboard for managing monitors and viewing stats.

Uptime Robot dashboard view

There is also a "TV Mode" for showing live stats, should you want a more permanent display in your office, for example. All of these views have a responsive layout, making it easy to check statuses from a mobile device.

Uptime Robot TV Mode

Since setting the monitor up, my site has been down a lot. I do not know for sure if this is more or less than usual because I was not monitoring it this closely before, but I learned that my hosting provider has been updating servers recently. These hardware changes have caused all sorts of havoc with the reliability of site up-time for a lot of people, it seems2. Thankfully, due to both Uptime Robot and the responsiveness of my hosting providers support team, most issues were discovered and resolved in a reasonable time.

During these availability issues, I learned that just finding out when my site is down was not sufficient, so I added an additional "site back up" rule to IFTTT. This turns out to be really useful when your site is down while one is sleeping as it removes the need to go check if it the site is back up upon waking.

In Conclusion

While I am disappointed that my site was down, I was really happy to see that my Uptime Robot monitoring was doing exactly what I wanted. Not only that, but I have screen grab showing less than perfect stats, which makes for a great addition to this blog.

Overview from dashboard

Uptime Robot is a nice discovery and a welcome addition to my suite of tools. The inclusion of a RSS feed to check monitor status as well as an API, which I am yet to explore, make it easy to integrate the information from Uptime Robot monitors into other tools.

  1. If This Then That: ifttt.com []
  2. I will refrain from going into detail on what I think about a company failing at their core purpose when doing something relating to that core business (feels a little like not serving food in a restaurant because they were buying new food) []

The Need For Speed

Hopefully, those who are regular visitors to this blog1 have noticed a little speed boost of late. That is because I recently spent several days overhauling the appearance and performance with the intent of making the blog less frustrating and a little more professional. However, the outcome of my effort turned out to have other pleasant side effects.

I approached the performance issues as I would when developing software; I used data. In fact, it was data that drove me to look at it in the first place. Like many websites, this site uses Google Analytics, which allows me to poke around the usage of my site, see which of the many topics I have covered are of interest to people, what search terms bring people here (assuming people allow their search terms to be shared), and how the site is performing on various platforms and browsers. One day I happened to notice that my page load speeds, especially on mobile platforms, were pretty bad and that there appeared to be a direct correlation between the speed of pages loading and the likelihood that a visitor to the site would view more than one page before leaving2 . Thankfully, Google provides via their free PageSpeed Insights product, tips on how to improve the site. Armed with these tips, I set out to improve things.

Google PageSpeed Insights

Now, in hindsight, I wish I had been far more methodical and documented every step— it would have made for a great little series of blog entries or at least improved this one —but I did not, so instead, I want to summarise some of the tasks I undertook. Hopefully, this will be a useful overview for others who want to tackle performance on their own sites. The main changes I made can be organized into server configuration, site configuration, and content.

The simplest to resolve from a technical perspective was content, although it remains the last one to be completed mainly due to the time involved. It turns out that I got a little lazy when writing some of my original posts and did not compress images as much as I probably should have. The larger an image file is, the longer it takes to download, and this is only amplified by less powerful mobile devices. For new posts, I have been resolving this as I go by using a tool called PNGGauntlet to compress my images as either JPEG or PNG before uploading them to the site. Sadly, for images already uploaded to the site, I could only find plugins that ran on Apache (my installation of WordPress is on IIS for reasons that I might go into another time), would cost a small fortune to process all the images, or had reviews that implied the plugin might work great or might just corrupt my entire blog. I decided that for now, to leave things as they are and update images manually when I get the opportunity. This means, unfortunately, it will take a while. Thankfully, the server configuration options helped me out a little.

On the server side, there were two things that helped. The first, to ensure that the server compressed content before sending it to the web browser, did not help with the images, but it did greatly reduce the size of the various text files (HTML, CSS, and JavaScript) that get downloaded to render the site. However, the second change made a huge difference for repeat visitors. This was to make sure that the server told the browser how long it could cache content for before it needed to be downloaded again. Doing this ensured that repeat visitors to the site would not need to download all the CSS, JS, images, and other assets on every visit.

With the content and the server configuration modified to improve performance, the next and most important focus was the WordPress site itself. The biggest change was to introduce caching. WordPress generates HTML from PHP code. This takes time, so by caching the HTML it produces, the speed at which pages are available for visitors is greatly increased. A lot of caching solutions for WordPress are developed with Apache deployments in mind. Thankfully, I found that with some special IIS-specific tweaking, WP Super Cache works great3 .

At this point, the site was noticeably quicker and almost all the PageSpeed issues were eliminated. To finish off the rest, I added a few plugins and got rid of one as well. I used the Autoptimize plugin to concatenate, minify, compress, and perform other magic on the HTML, CSS, and JS files (this improved download times just a touch more by reducing the number of files the browser must request, and reducing the size of those files), I added JavaScript to Footer, a plugin that moves JavaScript to after the fold so that the content appears before the JavaScript is loaded, I updated the ad code (from Google) to use their latest asynchronous version, and I removed the social media plugin I was using, which was not only causing poor performance but was also doing some nasty things with cookies.

Along this journey of optimizing my site, I also took the opportunity to tidy up the layout, audit the cookies that are used, improve the way advertisers can target my ads, and add a sitemap generator to improve some of the ways Google (and other search engines) can crawl the site4. In all, it took about five days to get everything up and running in my spare time.

So, was it worth it?

Before and after
Before and after

From my perspective, it was definitely worth it (please let me know your perspective in the comments). The image above shows the average page load, server response, and page download times before the changes (from January through April – top row) and after the changes (June – bottom row). While the page download time has only decreased slightly, the other changes show a large improvement. Though I cannot tell for certain what changes were specifically responsible (nor what role, if any, the posts I have been writing have played5 ), I have not only seen the speed improve, but I have also seen roughly a 50-70% increase in visitors (especially from Russia, for some reason), a three-fold increase in ad revenue6, and a small decrease in Bounce Rate, among other changes.

I highly recommend taking the time to look at performance for your own blog. While there are still things that, if addressed, could improve mine (such as hosting on a dedicated server), and there are some things PageSpeed suggested to fix that are outside of my control, I am very pleased with where I am right now. As so many times in my life before, this has led me to the inevitable thought, "what if I had done this sooner?"

  1. hopefully, there are regular visitors []
  2. The percentage of visitors that leave after viewing only one page is known as the Bounce Rate []
  3. Provided you don't do things like enable compressing in WP Super Cache and IIS at the same time, for example. This took me a while to understand but the browser is only going to strip away one layer of that compression, so all it sees is garbled nonsense. []
  4. Some of these things I might blog about another time if there is interest (the cookie audit was an interesting journey of its own). []
  5. though I possibly could with some deeper use of Google Analytics []
  6. If that is sustained, I will be able to pay for the hosting of my blog from ad revenue for the first time []

CiviCRM deployment on IIS WordPress

At Ann Arbor Give Camp this year, I worked on a team looking into donation management options for non-profits. Thanks to Dr. Milastname (it would be inappropriate to reveal his true identity), we found CiviCRM and spent much of the weekend getting familiar with its deployment and functionality inside of WordPress. CiviCRM integration with WordPress is a relatively new feature, so it was not totally unsurprising that we encountered one or two issues. The first and by far the biggest problem we encountered was the White Screen of Death (WSOD).

After some debugging (which involved editing a couple of PHP files inside of the WordPress and CiviCRM systems), we discovered that a PHP add-in used by CiviCRM for templating was relying on the `open_basedir` variable and this was not set on our IIS-based system. This caused the templating add-in to fail, halting the rendering of the CiviCRM admin screen and resulting in the WSOD.

To rectify this problem, I edited `wp_config.php` to introduce the `open_basedir` variable just before the `require` statement for `wp_settings.php`. I set the variable to the path of the WordPress deployment (`ABSPATH`) and refreshed the CiviCRM admin screen.

ini_set('open_basedir', ABSPATH);

This fixed the WSOD and enabled us to continue our evaluation of CiviCRM1. We also raised an issue against the CiviCRM project and added a post to the CiviCRM forms, ensuring the lessons we learned would benefit future users of CiviCRM.

  1. And discover a bug that I had introduced all by myself []

Drop the BOM: A Case Study of JSON Corruption in WordPress

GiveCampIn September, I attended Ann Arbor Give Camp, a local event that connects non-profits with the local developer community to fulfill technological goals. As part of the project I was working on, I installed a plugin called CiviCRM into a WordPress deployment that was running on an IIS-based server.

It turned out that WordPress integration for CiviCRM was relatively new and a problem unique to IIS-based deployments existed after installation. This led to a white screen when I tried to access CiviCRM. I spent some time troubleshooting and eventually found the issue after I edited two files to track it down. The fix was quickly implemented. Unfortunately, I then discovered that some other features were not working properly.

The primary places this new issue surfaced were in displaying dialog windows within CiviCRM. It turned out that these dialogs obtained their UI via an AJAX call that returned some JSON and for some reason, jQuery was indicating that the call failed. Investigating further, I saw that the API call was successful (it returned a 200 status result) and the JSON appeared completely fine. How strange.

JSON in binary editor of Visual Studio

I made some debug changes to the JavaScript using the Google Chrome development tools and looked at the failure method jQuery was calling. In doing so, I discovered jQuery was reporting a parsing error for the JSON result. This seemed bizarre, after all, the JSON looked fine to me. I decided to verify it by copying and pasting it into Sublime. Still, the JSON looked just fine. Being tenacious, I saved the JSON to a text file and then opened it in Visual Studio's binary editor and there, the problem appeared. There were two characters at the start of the file before the first brace: byte order marks.

Corrupted JSON in Google Chrome developer tools

A byte order mark (often referred to as a BOM) is a Unicode character used to indicate the endianness (byte order) of a text file or stream1. JSON is not supposed to include them at all. In hindsight, I could have seen this issue much sooner if I had paid closer attention to the JSON response in the Network tab of Chrome's developer tools. This view had shown two red dots (see above) before the opening brace, each dot corresponding to a BOM that Chrome knew shouldn't be there. Of course, I had no idea what they meant and so I promptly ignored them. Lesson learned.

So, armed with the knowledge of why the JSON was causing parser errors, I had to find out what was causing this malformation and fix it. After reading about how a BOM in an incorrectly formatted PHP file2 could cause BOMs to be prepended in the PHP output, I started looking at each PHP file that would be touched when generating the API response. Alas, nothing initially stood out. I was getting frustrated when I had an epiphany; I had edited exactly two files in trying to fix the installation issue and there were exactly two BOMs. Coincidence?

I went to the two files that I had edited, downloaded them and discovered they both had BOMs. I re-saved them, this time without a BOM and uploaded them back to the site, which fixed the JSON corruption and got the CiviCRM plug-in in to working order.

In tracking down and fixing this self-made issue, I learned a few valuable lessons:

  1. Learn to use my developer tools
  2. Never assume it is not my fault
  3. It pays to understand how things work

Hopefully, my misfortune in this one incident will help someone track down their own issue with corrupted JSON in WordPress. If so, please share in the comments. Together, our mistakes can be someone else's salvation.

  1. Wikipedia – http://en.wikipedia.org/wiki/Byte_order_mark []
  2. one saved as Unicode with byte order mark []