Tracepoints, Conditional Breakpoints, and Function Breakpoints

We've all been there: we step through our code with breakpoints and it works just fine, but run it without ever hitting a breakpoint and our code explodes in a fiery ball of enigmatic failure. Perhaps the failure only happens after the 1000th call of a method, when a variable is set to a specific value, or the value of a variable changes. These bugs can be hard to investigate without actually modifying the software that has the bug, which then means you are no longer debugging the same software that had the bug and might mean the bug disappears1.

Thankfully, Visual Studio has our backs on tracking down some of these more obscure bugs. Visual Studio allows us to modify our breakpoints to only break on certain conditions (like the 5th loop iteration, or when a file is open), to output text to the debug window, or to just output text and not actually break into our code. We can even create breakpoints that break on any function that matches a name we provide, just in case you don't even know which code it's actually calling.

Though I discuss the 2015 experience, the features themselves have been around for quite some time. I would not be surprised if this were the first time you had heard about these breakpoint settings, they have always been somewhat hidden away from the primary workflow. Even now, with the updated user experience, they are not obvious unless you go exploring.  If you want to see how to use them in your variant of Visual Studio, or get more information on breakpoints in 2015, MSDN has you covered (2003|2005|2008|2010|2012|2013|2015).

Conditions and Actions

Floating breakpoint toolbar

Let's begin by taking a look at adding conditions and tracepoints. When you add a breakpoint to a line of code, either by using the F9 keyboard shortcut or left-clicking in the code margin, a little toolbar appears to the upper right of the cursor2 . The toolbar has two icons: the first is called Settings…, where all the cool stuff lives; the second is called Disable Breakpoint, which is very useful if you have customized the breakpoint3. If you click the Settings… button, you will see an inline dialog with two checkboxes; Conditions and Actions4.

If you check the first box, Conditions, you will be presented with various fields for specifying a condition under which the breakpoint fires. There are three types of condition;

  1. Conditional Expression
  2. Hit Count
  3. Filter
Adding a condition to a breakpoint

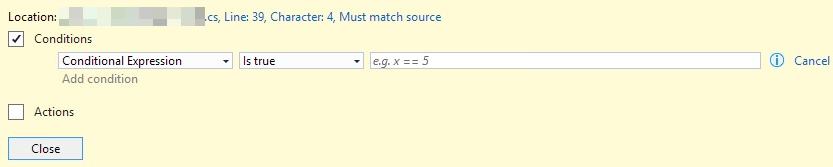
Conditional Expression conditions allow you to specify a condition based on variables within your code. You can break on when a specific condition is met, or when a condition changes (this allows you to break when a variable changes value, for example).

Hit Count conditions allow you to break once after the breakpoint has been hit a specific number of times (such as on the fifth index of an array in a loop), every time after the breakpoint has been hit a specific number of times, or every time the hit count is a multiple of a specific number (like every other hit, or once every five hits).

Filter conditions allow you to specify filters based on process, thread, and machine names, and process and thread identifiers.

Conditional breakpointYou can add multiple conditions to a breakpoint, which all have to match for the breakpoint to fire. When a condition is applied to a breakpoint, the red circle will have a white plus symbol inside it.

Adding output text to a breakpoint

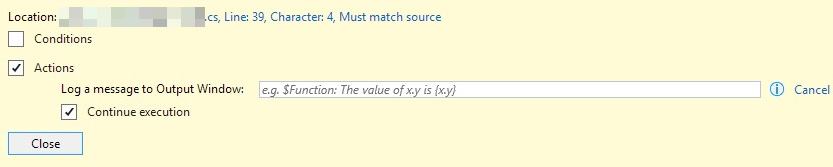
If you check the Actions box, you can specify text to be outputted when the breakpoint fires. By default, a checkbox named Continue Execution will be checked because, usually, if specifying output text, you want a tracepoint rather than a breakpoint. However, if you want to break and output text, you can uncheck this additional checkbox.

Non-breaking breakpoint (aka tracepoint)When a breakpoint is set to continue execution, the red circle changes into a red diamond. If a condition is also applied, the diamond has a white cross Conditional non-breaking breakpoint (aka tracepoint)in it.

If you use the Oz-code extension for Visual Studio, tracepoints are given some additional support with a quick action to add a tracepoint and a tracepoint viewer that shows you just tracepoints.

Function Breakpoints

Adding a function breakpoint

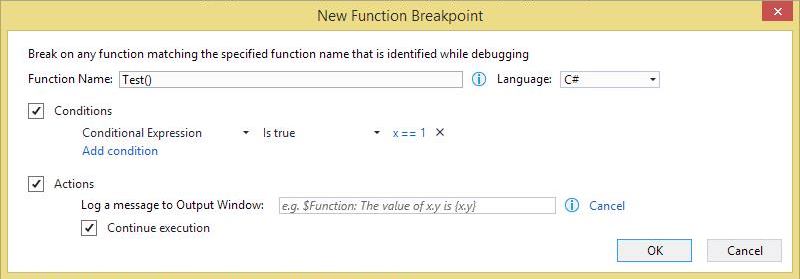
So far, we've looked at traditional breakpoints that are set on specific lines of code. Function breakpoints are set against function names. To add a function point, use the Visual Studio menu to go to Debug→New Breakpoint→Function Breakpoint…5. Selecting this will show a dialog where you can specify the function name (qualifying it as you require), and the language to which the breakpoint applies. You can also specify conditions and actions as with any other breakpoint.

In Conclusion…

Visual Studio is a complex development environment, which unfortunately leads to some of its cooler features being harder to find. I hope you find this introduction to breakpoint superpowers useful, if you do or if you have more Visual Studio debugging tips, I'd love to hear from you in the comments.

Today's featured image is "Debugging the Computer" by Jitze Couperus. The image is licensed under CC BY 2.0. Other than being resized, the image has not been modified.

  1. yay, fixed it… []
  2. This also appears if you hover over an existing breakpoint in the margin []
  3. Deleting the breakpoint would also delete any customization, but disabling does not []
  4. This dialog can also be reached by right-clicking the breakpoint and choosing either Conditions… or Actions… or by hitting Alt+F9, C; the only difference here is that one of the two checkboxes will get checked automatically []
  5. You can also add one via the keyboard with Alt+F9, B or the New… dropdown in the Breakpoints tool window []

Some of my favourite tools

Update: This post has been updated to recognise that CodeLineage is now maintained by Hippo Camp Software and not Red Gate Software as was originally stated.

If you know me, you might well suspect this post is about some of the idiots I know, but it is not, this is entirely about some of the tools I use in day-to-day development. This is by no means an exhaustive list, nor is it presented in any particular order. However, assuming you are even a little bit like me as a developer, you will see a whole bunch of things you already use, but hopefully there is at least one item that is new to you. If you do find something new and useful here, or you have some suggestions of your own, please feel free to post a comment.

OzCode

OzCode is an add-in for Visual Studio that provides some debugging super powers like collection searching, adding computed properties to objects, pinning properties so that you don't have to go hunting in the object tree, simpler tracepoint creation, and a bunch more. I first tried this during beta and was quickly sold on its value. Give the 30-day trial a chance and see if it works for you.

Resharper

This seems to be a staple for most C# developers. I was a late-comer to using this tool and I am not sure I like it for the same reasons as everyone else. I actually love Resharper for its test runner, which is a more performant alternative to Visual Studio's built-in Test Explorer, and the ability to quickly change file names to match the type they contain. However, it has a lot of features, so while this is not free, give the trial a chance and see if it fits.

Web Essentials

Another staple for many Visual Studio developers, Web Essentials provides lots of support for web-related development including enhanced support for JavaScript, CSS, CoffeeScript, LESS, SASS, MarkDown, and much more. If you do any kind of web development, this is essential1.

LinqPad

I was late to the LinqPad party, but gave it a shot during Ann Arbor Give Camp 2013 and within my first hour or two of using it, dropped some cash on the premium version (it is very inexpensive for what you get). Since then, whether it is hacking code or hacking databases, I have been using LinqPad as my standard tool for hacking.

For code, it does not have the overhead of creating projects and command line, WinForms or WPF wrapper tools that you would have to do in Visual Studio. For databases, LinqPad gives you the freedom to use SQL, C#, F# or VB for querying and manipulating your database as well as support for many different data sources beyound just SQL Server, providing an excellent alternative to SQL Management Studio.

LinqPad is free, but you get some cool features if you go premium, and considering the sub-$100 price, it is totally worth it.

JustDecompile

When Red Gate stopped providing Reflector for free, JetBrains and Telerik stepped up with their own free decompilers for poking around inside .NET code. These are often invaluable when tracking down obscure bugs or wanting to learn more about the code that is running when you did not write it. While JetBrains' dotPeek is useful, I have found that JustDecompile from Telerik has a better feature set (including showing MSIL, which I could not find in dotPeek).

Chutzpah

Chutzpah is a test runner for JavaScript unit tests and is available as a Nuget package. It supports tests written for Jasmine, Mocha, and QUnit, as well as a variety of languages including CoffeeScript and TypeScript. There are also two Visual Studio extensions to provide Test Explorer integration and a handy context menu. I find the context menu most useful out of these.

Chutzpah is a great option when you cannot leverage a NodeJS-based tool-chain like Grunt or Gulp, or some other non-Visual Studio build process.

CodeLineage

CodeLineage is a free Visual Studio extension from Hippo Camp Software2. Regardless of your source control provider, CodeLineage provides you with a simple interface for comparing different points in the history of a given file. The simple interface makes it easy to select which versions to compare. I do not use this tool often, but when I need it, it is fantastic.

FileNesting

This Visual Studio extension from the developer of Web Essentials makes nesting files under one another a breeze. You can set up automated nesting rules or perform nesting manually.

I like to keep types separated by file when developing in C#. Files are cheap and it helps discovery when navigating code. However, this sometimes means using partial classes to keep nested types separate, so to keep my solution explorer tidy, I edit the project files and nest source code files. I also find this useful for Angular directives, allowing me to apply the familiar pattern  of organizing code-behind under presentation by nesting JavaScript files under the template HTML.

Whether you have your own nesting guidelines or want to ensure generated code is nested under its corresponding definition (such as JavaScript generated from CoffeeScript), this extension is brilliant.

Switch Startup Project

Ever hit F5 to debug only to find out you tried to start a non-executable project and have to hunt for the right project in the Solution Explorer? This used to happen to me a lot, but not since this handy extension, which adds a drop down to the toolbar where I can select the project I want to be my startup project. A valuable time saver.

MultiEditing

Multi-line editing has been a valuable improvement in recent releases of Visual Studio, but it has a limitation in that you can only edit contiguous lines at the same column location. Sometimes, you want to edit multiple lines in a variety of locations and with this handy extension, you can. Just hold ALT and click the locations you want to multi-edit, then type away.

Productivity Power Tools

Productivity Power Tools for Visual Studio have been a staple extension since at least Visual Studio 2008. Often the test bed of features that eventually appear as first class citizens in the Visual Studio suite, Productivity Power Tools enhances the overall Visual Studio experience.

The current version for Visual Studio 2013 provides support for colour printing, custom document tabs, copying as HTML, error visualization in the Solution Explorer, time stamps in the debug output margin, double-click to maximize and dock windows, and much more. This is a must-have for any Visual Studio user.

  1. yes, I went there []
  2. though it was maintained by Red Gate when I first started using it []

Kalamazoo X 2014

Last year, I experienced the Kalamazoo X Conference for the very first time. It was an extremely emotional experience and one of two events that catalysed some ongoing personal change (the other was changing jobs after 12 years).

This year, I returned to Kalamazoo X, curious as to what the experience would hold. It was daunting; it felt different.

It wasn't worse different or better different. It wasn't different because the talks were new or the venue had changed to accommodate more attendees. I initially thought it was different because last year's talks were focused on the self and "accepting who you are", whereas this year's centered around others and how we can benefit those around us.  But then I realised that view is coloured by who I am (or was). It was different because I was different.

My life changed after attending Kalamazoo X last year. After the conference (perhaps even during), I started to reflect on who I was, faced old and painfully familiar demons, and began focusing on my well-being in a way I had not allowed myself to before. I began to recognise that I was broken and as the weight of one of the worst winters in history crushed my spirit, I finally sought professional help.

It was a long time coming. Friends had urged me to try counseling for years and perhaps once or twice, I had conceded they had a point, but that was just to shut them up; I knew I wasn't weak like that, I was strong enough to weather my problems alone, to be a "man", to cope. But coping isn't enough. It isn't enough for me or those around me and coming to that realisation is crushing, at least at first.

I am still working through that personal change, the cliched "journey of self-discovery", and I am all the better for it. Kalamazoo X 2013 started something, something that affected how I experienced Kalamazoo X 2014 and life in general. I am certain Kalamazoo X 2014 has started something too.

For me, Kalamazoo X isn't about learning something new or retweeting a pithy statement (though I certainly enjoyed that part). It is about perception and coming to terms with the things I have to let go. It's about growing and perceiving that growth.

I hope to return to Kalamazoo and the X conference year upon year, not only to measure my own growth, but also to see the growth of others. The software development community is incredibly nurturing and nowhere exemplifies that more than Kalamazoo X.