Debugging IIS Express website from a HyperV Virtual Machine

Recently, I had to investigate a performance bug on a website when using Internet Explorer 8. Although we are fortunate to have access to BrowserStack for testing, I have not found it particularly efficient for performance investigations, so instead I used an HyperV virtual machine (VM) from modern.IE.

I had started the site under test from Visual Studio 2013 using IIS Express. Unfortunately, HyperV VMs are not able to see such a site out-of-the-box. Three things must be reconfigured first: the VM network adapter, the Windows Firewall of the host machine, and IIS Express.

HyperV VM Network Adapter

HyperV Virtual Switch Manager

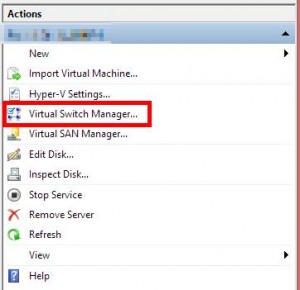
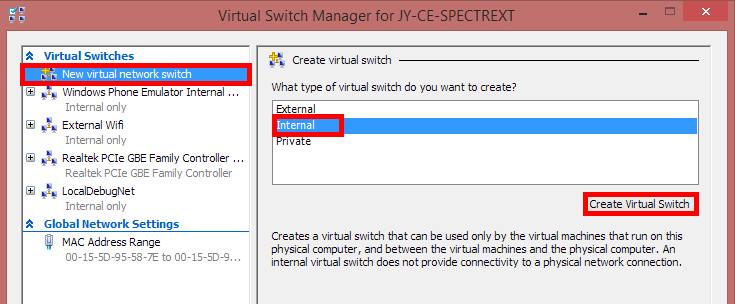
In HyperV, select Virtual Switch Manager… from the Actions list on the right-hand side. In the dialog that appears, select New virtual network switch on the left, then Internal on the right, then click Create Virtual Switch. This creates a virtual network switch that allows your VM to see your local machine and vice versa. You can then name the switch anything you want; I called mine LocalDebugNet.

New virtual network switch

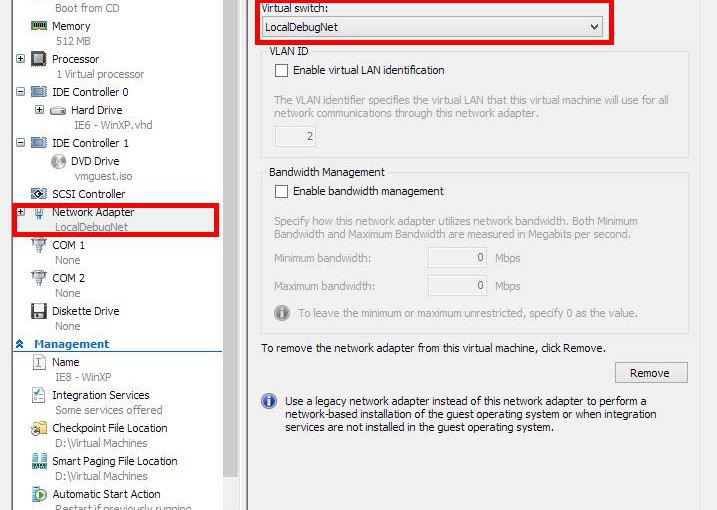
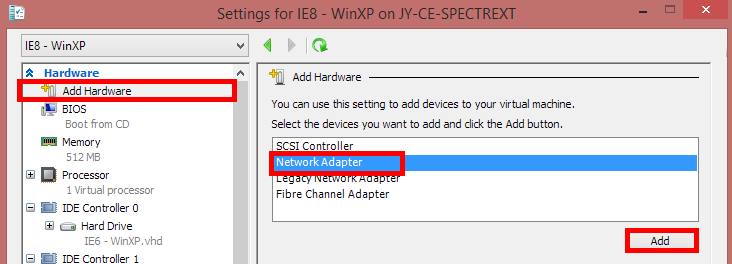
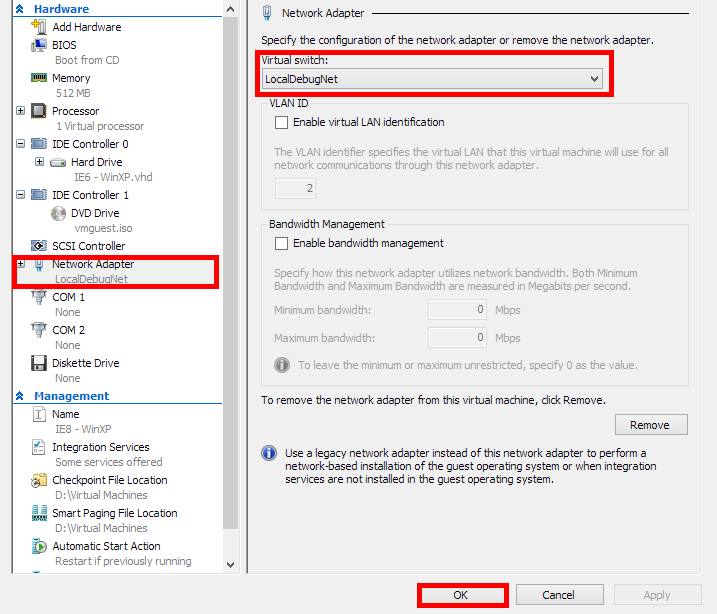
To ensure the VM uses the newly created virtual switch, select the VM and choose Settings… (either from the context menu or the lower-right pane). Choose Add Hardware in the left-hand pane and add a new Network Adapter, then drop down the virtual switch list on the right, choose the switch you created earlier, and click OK to accept the changes and close the dialog.

Add network adapter
Add network adapter
Set virtual switch on network adapter

Now the VM is setup and should be able to see its host machine on its network. Unfortunately, it still cannot see the website under test. Next, we have to configure IIS Express.

IIS Express

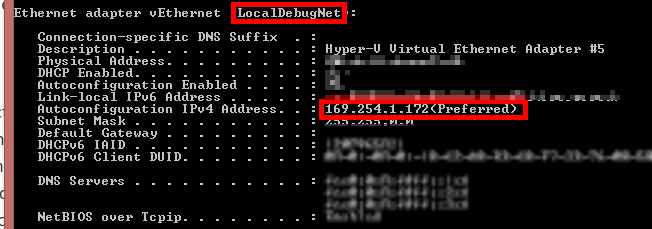
Open up a command prompt on your machine (the host machine, not the VM) and run ipconfig /all . Look in the output for the virtual switch that you created earlier and write down the corresponding IP address1.

Command prompt showing ipconfig

Open the IIS Express applicationhost.config file in your favourite text editor. This file is usually found under your user profile.

notepad %USERPROFILE%\documents\iisexpress\config\applicationhost.config

Find the website that you are testing and add a binding for the IP address you wrote down earlier and the port that the site is running on. You can usually just copy the localhost binding and change localhost to the IP address or your machine name.

You will also need to run this command as an administrator to add an http access rule, where <ipaddress>  should be replaced with the IP you wrote down or your machine name, and <port>  should be replaced with the port on which IIS Express hosts your website.

netsh http add urlacl url=http://<ipaddress>:<port>/ user=everyone

At this point, you might be in luck. Try restarting IIS Express and navigating to your site from inside the HyperV VM. If it works, you are all set; if not, you will need to add a rule to the Windows Firewall (or whatever firewall software you have running).

Windows Firewall

The VM can see your machine and IIS Express is binding to the appropriate IP address and port, but the firewall is preventing traffic on that port. To fix this, we can add an inbound firewall rule. To do this, open up Windows Firewall from Control Panel and click Advanced Settings or search Windows for Windows Firewall with Advanced Security and launch that.

Inbound rules in Windows Firewall

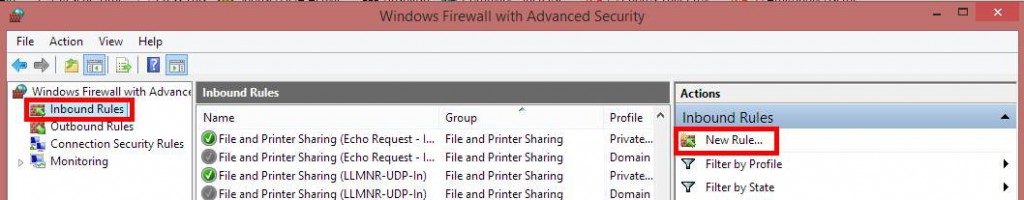
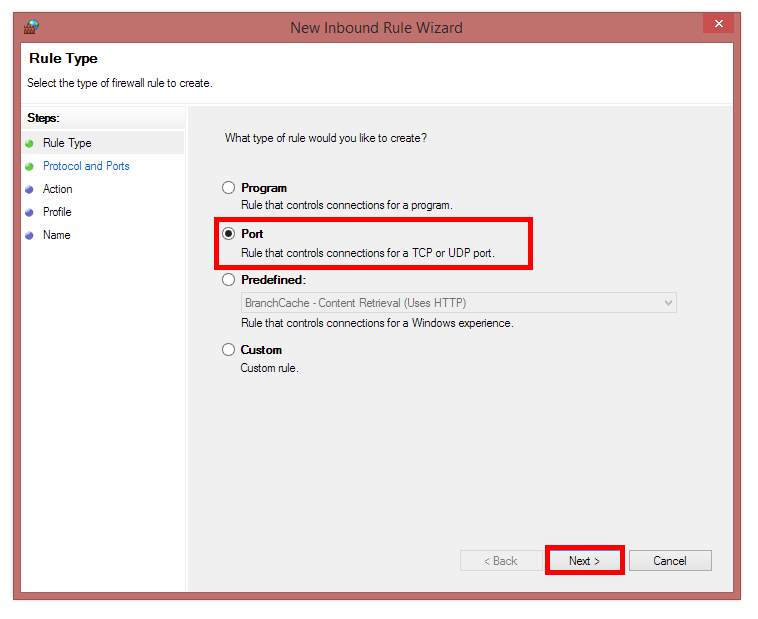
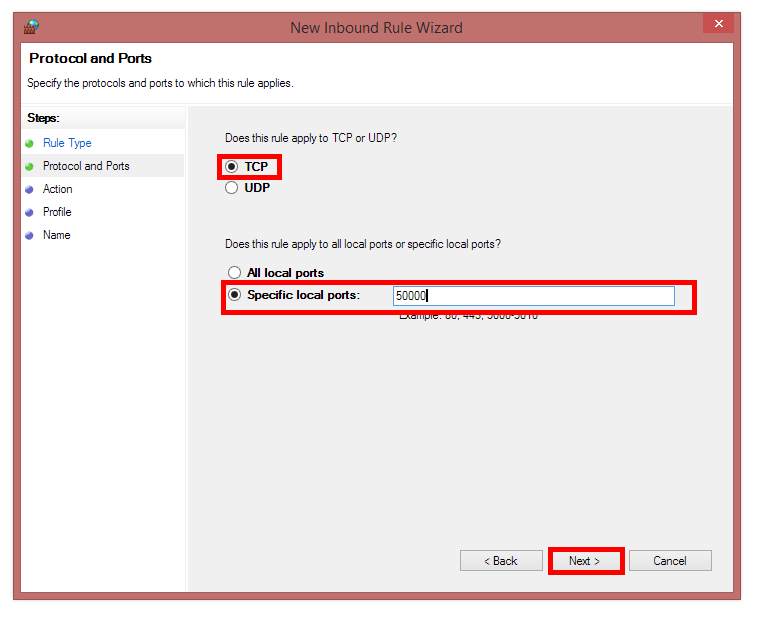
Select Inbound Rules on the left, then New Rule… on the right and set up a new rule to allow connections the port where your site is hosted by IIS Express. I have shown an example here in the following screen grabs, but use your own discretion and make sure not to give too much access to your machine.

New inbound port rule
Specifying rule port
Setting rule to allow the connection
Inbound rule application
Naming the rule
Naming the rule

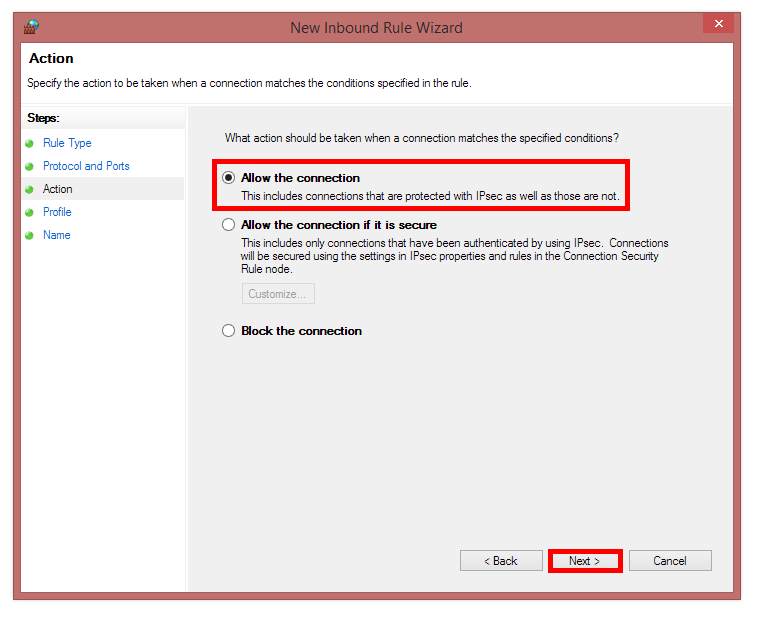
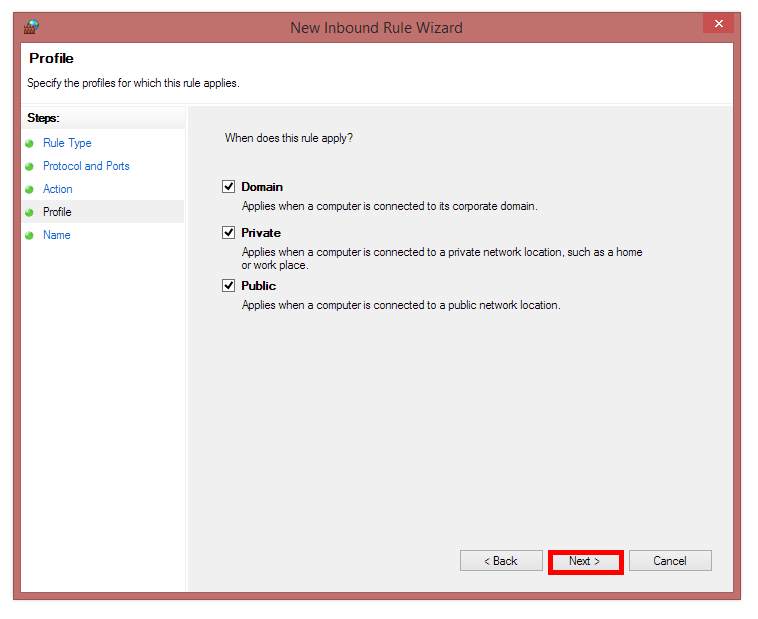
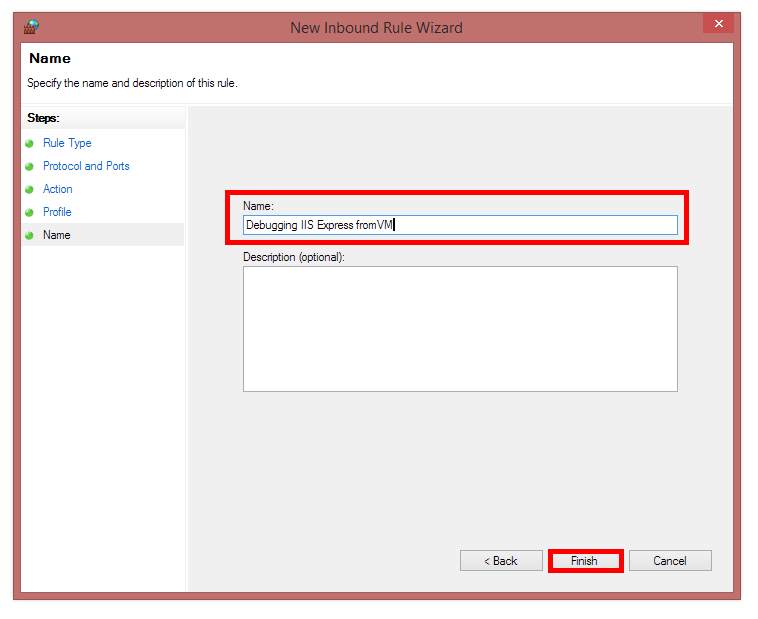
Once you have set up a rule to allow access via the appropriate port, you should be able to see your IIS Express hosted site from inside your VM of choice.

As always, if you have any feedback, please leave a comment.

  1. You can also try using the name of your machine for the following steps instead of the IP []

CiviCRM deployment on IIS WordPress

At Ann Arbor Give Camp this year, I worked on a team looking into donation management options for non-profits. Thanks to Dr. Milastname (it would be inappropriate to reveal his true identity), we found CiviCRM and spent much of the weekend getting familiar with its deployment and functionality inside of WordPress. CiviCRM integration with WordPress is a relatively new feature, so it was not totally unsurprising that we encountered one or two issues. The first and by far the biggest problem we encountered was the White Screen of Death (WSOD).

After some debugging (which involved editing a couple of PHP files inside of the WordPress and CiviCRM systems), we discovered that a PHP add-in used by CiviCRM for templating was relying on the `open_basedir` variable and this was not set on our IIS-based system. This caused the templating add-in to fail, halting the rendering of the CiviCRM admin screen and resulting in the WSOD.

To rectify this problem, I edited `wp_config.php` to introduce the `open_basedir` variable just before the `require` statement for `wp_settings.php`. I set the variable to the path of the WordPress deployment (`ABSPATH`) and refreshed the CiviCRM admin screen.

ini_set('open_basedir', ABSPATH);

This fixed the WSOD and enabled us to continue our evaluation of CiviCRM1. We also raised an issue against the CiviCRM project and added a post to the CiviCRM forms, ensuring the lessons we learned would benefit future users of CiviCRM.

  1. And discover a bug that I had introduced all by myself []

Drop the BOM: A Case Study of JSON Corruption in WordPress

GiveCampIn September, I attended Ann Arbor Give Camp, a local event that connects non-profits with the local developer community to fulfill technological goals. As part of the project I was working on, I installed a plugin called CiviCRM into a WordPress deployment that was running on an IIS-based server.

It turned out that WordPress integration for CiviCRM was relatively new and a problem unique to IIS-based deployments existed after installation. This led to a white screen when I tried to access CiviCRM. I spent some time troubleshooting and eventually found the issue after I edited two files to track it down. The fix was quickly implemented. Unfortunately, I then discovered that some other features were not working properly.

The primary places this new issue surfaced were in displaying dialog windows within CiviCRM. It turned out that these dialogs obtained their UI via an AJAX call that returned some JSON and for some reason, jQuery was indicating that the call failed. Investigating further, I saw that the API call was successful (it returned a 200 status result) and the JSON appeared completely fine. How strange.

JSON in binary editor of Visual Studio

I made some debug changes to the JavaScript using the Google Chrome development tools and looked at the failure method jQuery was calling. In doing so, I discovered jQuery was reporting a parsing error for the JSON result. This seemed bizarre, after all, the JSON looked fine to me. I decided to verify it by copying and pasting it into Sublime. Still, the JSON looked just fine. Being tenacious, I saved the JSON to a text file and then opened it in Visual Studio's binary editor and there, the problem appeared. There were two characters at the start of the file before the first brace: byte order marks.

Corrupted JSON in Google Chrome developer tools

A byte order mark (often referred to as a BOM) is a Unicode character used to indicate the endianness (byte order) of a text file or stream1. JSON is not supposed to include them at all. In hindsight, I could have seen this issue much sooner if I had paid closer attention to the JSON response in the Network tab of Chrome's developer tools. This view had shown two red dots (see above) before the opening brace, each dot corresponding to a BOM that Chrome knew shouldn't be there. Of course, I had no idea what they meant and so I promptly ignored them. Lesson learned.

So, armed with the knowledge of why the JSON was causing parser errors, I had to find out what was causing this malformation and fix it. After reading about how a BOM in an incorrectly formatted PHP file2 could cause BOMs to be prepended in the PHP output, I started looking at each PHP file that would be touched when generating the API response. Alas, nothing initially stood out. I was getting frustrated when I had an epiphany; I had edited exactly two files in trying to fix the installation issue and there were exactly two BOMs. Coincidence?

I went to the two files that I had edited, downloaded them and discovered they both had BOMs. I re-saved them, this time without a BOM and uploaded them back to the site, which fixed the JSON corruption and got the CiviCRM plug-in in to working order.

In tracking down and fixing this self-made issue, I learned a few valuable lessons:

  1. Learn to use my developer tools
  2. Never assume it is not my fault
  3. It pays to understand how things work

Hopefully, my misfortune in this one incident will help someone track down their own issue with corrupted JSON in WordPress. If so, please share in the comments. Together, our mistakes can be someone else's salvation.

  1. Wikipedia – http://en.wikipedia.org/wiki/Byte_order_mark []
  2. one saved as Unicode with byte order mark []

Crash handling in Silverlight (Part Two)

This post is the second part of a two part series.

Adding a little polish

In part one of this series we learned about the basic out-of-the-box crash handling that a new Silverlight project provides for both in- and out-of-browser applications, we learned how we can catch unhandled exceptions inside our application or let them escape into the browser to be handled by JavaScript (or a bit of both) and we learned that we are at the mercy of the HTML bridge.

What we had was far from fancy; the user would end up with a potentially broken Silverlight application or a blank screen and only some cryptic text in the JavaScript console to explain. This is not how we make friends, but now that we have a foundation, we can look at how to enhance the experience for our quality departments, ourselves and the poor souls that must suffer for our mistakes, our users. However, some simple modifications to our error handler can move the cryptic text out of the console into the page. We can even add some pizzazz and remove most of the cryptic text too. So let's take what we were left with at the end of part one and add a little polish.

In the following example, I've constructed a simple page that gives the user some information and provides a mailto link for sending the details to our QA department. When a crash occurs, the Silverlight application is hidden and the error page is displayed, customized to the specific error code1 and information.

function onSilverlightError(sender, args) {
    var errorType = args.ErrorType;
    var iErrorCode = args.ErrorCode;

    var emailMessage = "Dear Support,%0A%0A" +
        "Your application crashed.%0A%0A" +
        "Honestly, I only:%0A" +
        " ADD SOME DETAIL OF WHAT HAPPENED HERE%0A%0A" +
        "If you could fix this, that would be super awesome.%0A%0A" +
        "Thanks,%0A" +
        "A Very Important User%0A%0A~~~~~~~~%0A%0A";

    if (sender != null && sender != 0) {
        emailMessage += "Source: " + sender.getHost().Source + "%0A";
    }
    emailMessage += "Code: " + iErrorCode + "%0A";
    emailMessage += "Category: " + errorType + "%0A";
    emailMessage += "Message: " + args.ErrorMessage + "%0A";

    if (errorType == "ParserError") {
        emailMessage += "File: " + args.xamlFile + "%0A";
        emailMessage += "Line: " + args.lineNumber + "%0A";
        emailMessage += "Position: " + args.charPosition + "%0A";
    }
    else if (errorType == "RuntimeError") {
        if (args.lineNumber != 0) {
            emailMessage += "Line: " + args.lineNumber + "%0A";
            emailMessage += "Position: " + args.charPosition + "%0A";
        }
        emailMessage += "Method Name: " + args.methodName + "%0A";
    }

    var errorScreen = "<h1>Hello World!</h1>"
        + "<p>Sorry, but our application appears to have left the building.</p>"
        + "<p>Please <a href=\"mailto:quality@example.com\?subject=Incident Report&body="
        + emailMessage
        + "\">click here</a> and send us an e-mail.</p>";
    document.getElementById("silverlightControlHost").style.display = "none";
    var errorDiv = document.getElementById("errorLocation");
    errorDiv.innerHTML = errorScreen;
    errorDiv.style.display = "block";
}

Now, I understand, this is not the most elegant JavaScript in the world, but it works. Here is what your user sees…

Example of what a user will see when the application crashes

…and if the user clicks our mailto link, they'll get something like this…

Example of the auto-generated e-mail incident report

The example could be expanded to add additional information such as the URL of the application, the version of Silverlight and the user agent string by just modifying the JavaScript to include that information2. You could even show the same information on the HTML page that you include in the e-mail (in fact, you can go even further than that, just use your imagination…or read on for some suggestions). And yes, a little CSS would help, but I never promised it would be pretty—pretty can come later; I'm aiming for functional and as functional goes for showing that something is non-functional, this is good enough.

A bridge too far

Of course, as we have access to all the wonders of HTML and JavaScript, we could do so much more. For example, we could play a video to entertain the user while we call a web service that sends our error report automatically to our servers and tweets an apology (it's the personal touches that count). However, it doesn't matter how fancy and special we make the crash experience, it is all for nought once the user installs and uses our application out-of-browser or the HTML bridge is disabled. So, what do we do?

Out of the browser and into the app

The simplest way I have found to handle crash reporting in an out-of-browser application (or an application that lacks the HTML bridge) is to throw up a ChildWindow containing the details of the crash and provide no discernible means to dismiss it, thus disabling your application from further use without closing the application. This relies on the Silverlight runtime remaining intact even though your application suffered a problem; however, from my experience, crashes that take out the runtime are rare, especially in applications that have been tested and have well-formed, correct XAML.

Of course, if the runtime is still working, why stop at a ChildWindow? If you have access to the Silverlight runtime, you could do more like call a web service call or use some trusted API3 or COM4 interface. Whatever you try, exercise caution as you don't want your crash handling to crash as well. Keep it simple and it will serve you well.

Conclusions

Whichever route you choose, you should work hard to cater for all the scenarios that might be encountered, that way you will provide the support your user deserves. When deciding on your crash reporting strategy, always consider:

  • What level of network connectivity might be available?
  • Will the application be in- or out-of-browser? Do you support both?
  • Will the application be trusted and therefore have access to COM or Windows APIs?5
  • What Silverlight runtime(s) will you want to support?
  1. If you were paying attention there, you may have noticed that I mentioned the error code. There are many error codes that can be reported by Silverlight. You can use the error code to tailor your report or even consider not reporting a crash at all, but that depends on just how badly your application will react to the error. []
  2. Getting the User Agent string or the site URL are relatively simple, especially when compared with retrieving the Silverlight runtime version from within JavaScript. Thankfully, this was solved already, just visit this blog for details. []
  3. Silveright 5 []
  4. Silverlight 4 and up []
  5. Starting in Silverlight 5, both in- and out-of-browser trusted applications are supported. Earlier versions only support trusted applications when out-of-browser. []

Crash handling in Silverlight (Part One)

This post is the first part of a two part series.

I love working with Silverlight but once in a while I get it wrong and I, or worse, a user experiences a crash incident. I believe it is important for developers to acknowledge that incidents will occur and to include incident handling and reporting as first class citizens in the software we write. It benefits both us and our users by providing both a graceful degradation of our application and a source of feedback regarding application stability and bugs.

In this and subsequent posts, I want to take a look at the functionality a new Silverlight project includes for handling and reporting incidents, and then build upon it to give us some top notch error handling in our Silverlight applications.

So, let's start with the basics1

Create a new Silverlight application (including a companion ASP.NET web application or website) and you'll get two flavours of error handling: the first reports errors when you're not debugging your application and the second reports errors when you are2. When there is no debugger attached, errors are reported to the DOM via the HTML bridge. This all happens in App.xaml.cs via an event handler for the Application.UnhandledException event, which is subscribed in the class constructor. The event handler checks whether the debugger is attached and if it is not, it sends the error to the DOM via the cunningly-named ReportErrorToDOM method. The comments in Application_UnhandledException explain what is happening. Also, note that the event is being marked as handled, meaning our application won't stop running just because of this pesky exception.

private void Application_UnhandledException(object sender, ApplicationUnhandledExceptionEventArgs e)
{
    // If the app is running outside of the debugger then report the exception using
    // the browser's exception mechanism. On IE this will display it a yellow alert
    // icon in the status bar and Firefox will display a script error.
    if (!System.Diagnostics.Debugger.IsAttached)
    {
        // NOTE: This will allow the application to continue running after an exception has been thrown
        // but not handled.
        // For production applications this error handling should be replaced with something that will
        // report the error to the website and stop the application.
        e.Handled = true;
        Deployment.Current.Dispatcher.BeginInvoke(delegate
        {
            ReportErrorToDOM(e);
        });
    }
}

And a quick look at ReportErrorToDOM shows us the HTML bridge is being used to evaluate some JavaScript that will throw an exception inside the hosting browser.

private void ReportErrorToDOM(ApplicationUnhandledExceptionEventArgs e)
{
    try
    {
        string errorMsg = e.ExceptionObject.Message + e.ExceptionObject.StackTrace;
        errorMsg = errorMsg.Replace('"', '\'').Replace("\r\n";, @"\n");

        System.Windows.Browser.HtmlPage.Window.Eval(
            "throw new Error(\"Unhandled Error in Silverlight Application " + errorMsg + "\");");
    }
    catch (Exception)
    {
    }
}

If you try this and you're using a recent browser, it's very likely that you won't even notice anything happened. I put a button on my vanilla application and tied that to a click-event handler that throws an InvalidOperationException exception. Clicking it in IE9 gave me nothing until I pressed F12, viewed the Console in the developer tools and tried again. In some older browsers, a dialog box may appear indicating a scripting error.

Console in IE9 after a crash using basic Silverlight exception handling

I'll leave it as an exercise for you to go and see exactly what this looks like in your browser of choice, but I think we can all agree that with error handling like this our users must surely feel a warm fuzzy glow (especially with our hidden, cryptic error message and an application that continues running, unfettered by the potentially fatal bug lurking within). In fact, if the HTML bridge is disabled3, there isn't even a cryptic error message!

However, you'll be pleased to read that things are almost ever so very slightly better different when we have the debugger attached.

Attaching the debugger

The exception handler we just looked at only reports the error to the DOM when the debugger is not attached (and the HTML bridge is enabled). When the debugger is attached, the handler does nothing at all and the exception goes unhandled by our application. So what happens next?

Well, when an unhandled exception leaves our application, the Silverlight host looks for a JavaScript method assigned to the onError parameter. If there is such a method, it calls that and stops the application. The default handler is defined for us in the auto-generated HTML and ASPX. You can see its assignment in the default HTML and ASPX pages generated for us when we created our Silverlight application.

<object data="data:application/x-silverlight-2," type="application/x-silverlight-2" width="100%" height="100%">
    <param name="source" value="ClientBin/AgIncidentReporting.xap"/>
    <param name="onError" value="onSilverlightError" />
    <param name="background" value="white" />
    <param name="minRuntimeVersion" value="4.0.50826.0" />
    <param name="autoUpgrade" value="true" />
    <a href="http://go.microsoft.com/fwlink/?LinkID=149156&v=4.0.50826.0" style="text-decoration:none">
        <img src="http://go.microsoft.com/fwlink/?LinkId=161376" alt="Get Microsoft Silverlight" style="border-style:none"/>
    </a>
</object>

The default JavaScript handler generates an error similar to the one we get without the debugger, but with a few extra details4. Unfortunately, just like when the debugger isn't attached, disabling the HTML bridge (or running out-of-browser) also disables the error being reported.

Console in IE9 after a crash using basic Silverlight exception handling with debugger attached

The story so far…

In this introduction to Silverlight incident handling we have seen that, out of the box, we get some basic reporting that in a release scenario, will allow the application to continue running and will output a stack trace in the console5 but, when debugging, will stop the application and output a stack trace plus the added bonus of some extra details5.

I think you will agree, this is not a first class system for handling errors. Of course, all is not lost and in the next post we will look at how we can expand this error handling to be more helpful to both us and our users, perhaps even coping without the HTML bridge. That said, if this is all you use, I recommend deleting the code from App.xaml.cs so that the "debugger attached" style handling is used for all scenarios6. At least that way, when your application crashes, the user won't be able to continue using the application in blissful ignorance of whatever dangers lurk beneath.

  1. More detailed information on error handling in Silverlight, can be found here. []
  2. I am using Visual Studio 2010 Professional SP1 with the Silverlight 4 SDK. All line numbers refer to a vanilla Silverlight project created using New Project in the File menu. []
  3. You can disable the HTML bridge by adding <param name="enableHtmlAccess" value="false" /> to your Silverlight object declaration or by running your application out-of-browser. []
  4. The Category value is only available if the development runtime is installed, but the Code value is provided with all runtimes. It indicates the type of error, which can be looked up here. []
  5. If we're running in a browser with the HTML bridge enabled. [] []
  6. Please don't actually use this as your error handling. Although it is in the most part, better for the user, your application will appear to crash a little more often as the onError handler gets called for more than just unhandled exceptions. []